

Introduction
The challenge of providing meaningful employment for young adults in Africa has become an important focus in the development community. Unemployment rates among youth everywhere are higher than among adults. In Kenya, nearly 75 percent of the population is under age 30, and 26 percent of youth ages 15–24 are unemployed (United Nations Development Programme, 2018). Kenyan youth appear to be increasingly rejecting rural agricultural livelihoods (Afande et al., 2015; Republic of Kenya Ministry of Agriculture, Livestock and Fisheries, 2017) and migrating to cities, where a lack of rural employment opportunities resurfaces as urban unemployment and underemployment.
In parallel, increasing migration has raised concerns about rural youth abandoning agriculture, and the implications for agricultural production and food security. The food and agriculture sector is still the largest employer of young people (Yeboah, 2018), but increasing rural-urban migration rates (UN Habitat, 2018) and concerns that youth prefer nonagricultural employment have prompted the development community to explore ways to harness the potential of youth to revitalize rural agricultural economies.
To inform such solutions, we explore the migration patterns of youth from predominantly agricultural areas in Western Kenya (specifically Bungoma County), the profile of those migrants who plan to return to their villages, and implications for the agricultural workforce. Using data from a survey of approximately 2,400 rural-urban youth migrants conducted in 2017 from two rural counties (Bungoma and Garissa), we uncover behaviors and aspirations of this important yet difficult-to-study cohort.
Literature Review
Many studies have attempted to elucidate youths’ perspectives on agriculture and the factors that drive migration, including in Western Kenya. Youth state that educational and employment opportunities drive their decision to migrate to urban areas (Kristensen & Birch-Thomsen, 2013; Miguel & Hamory, 2009). In Western Kenya, youth migrating for employment opportunities report doing so because the education they have received is better aligned with urban jobs (Oucho et al., 2014) and young women cite marriage as a driver of migration to urban areas (Miguel & Hamory, 2009). Other factors cited by Kenyan youth as reasons to move to urban areas include poor rural living conditions, cultural practices, and access to health and other services in urban areas (Miguel & Hamory, 2009; Oucho et al., 2014).
Many studies have sought to understand why youth are not interested in agriculture, though most use qualitative methods and/or small sample sizes. Overwhelmingly, this body of research points to limited access to land as a barrier to agricultural livelihoods in Kenya (Mwangi et al., 2016; Njenga et al., 2012; Noorani, 2015; Osti et al., 2015; Oucho et al., 2014). Similarly, lack of access to finance is frequently cited as a deterrent (Mwangi et al., 2016; Njenga et al., 2012; Noorani, 2015; Osti et al., 2015). Some studies note that school curricula are not aligned with agriculture (Njenga et al., 2012; Osti et al., 2015). Preferences and perceptions are also cited as deterrents to agricultural livelihoods, including perceived low productivity, returns, and earning potential of farming; seasonality and uncertainty of income; intensity of manual labor; desire for a more professional or respectable career; and general lack of interest (Kristensen & Birch-Thomsen, 2013; Leavy & Hossain, 2014; Mwangi et al., 2016; Njenga et al., 2012; Osti et al., 2015; Oucho et al., 2014).
These studies leave gaps in our understanding of youth out-migration from rural areas. Many of the studies listed previously on youths’ perspectives on agriculture draw on interviews with village youth who have not migrated. Few of the studies employ rigorous methodologies (Miguel & Hamory, 2009, is a notable exception), and few target large sample sizes of youth who have already migrated—likely because this population is difficult to find. Policymakers and practitioners are challenged to support youth migrants in preparing for and finding productive employment, in part because of a limited understanding of migration experiences.
Methodology
We used a mixed methods approach, including qualitative focus groups and key informant interviews, and an in-person survey.
Qualitative Methodology
To elicit insights about the migration experience, we conducted 12 qualitative focus group discussions with youth migrants (see Table 1).
In addition, we conducted 24 key informant interviews with stakeholders within the youth migrant communities. We conducted 12 interviews in Nairobi, 6 each with migrants from Garissa and Bungoma, plus 6 interviews in Bungoma Town and 6 in Garissa Town. Key informants were selected based on their interactions with and knowledge about the migrant populations of interest and included employers, educators, and community leaders. Focus group discussions and key informant interviews were conducted in Kiswahili and Luhya for Bungoma youth migrants and in Kiswahili and Somali for Garissa youth migrants. We captured data by audio recording and notetaking.
For the analysis, we first categorized focus group discussion content across common themes emerging from the discussions. We then supplemented comments with analysis of key informant interviews. We developed a separate qualitative methods report outlining the key findings (currently pending review at a journal), and we used that report to inform our analysis of the survey data.
Quantitative Methodology
For the quantitative survey, RTI’s data collection partner Research Solutions Africa (RSA) surveyed 2,417 Kenyans between the ages of 18 and 35 born in rural areas in Bungoma and Garissa counties who had since migrated to major towns or Nairobi. We used respondent-driven sampling (RDS), a method of chain referral sampling created to study hard-to-reach populations. RDS functions like a snowball sample, with several important modifications that minimize the biases of snowball sampling (Heckathorn, 2002).[1]
RSA began data collection by recruiting 20 “seed” respondents, selected from focus group discussion participants. After participating in the survey, respondents were asked to recruit up to three people to participate in the study. Respondents received 50 shillings (~US $0.50) in phone airtime for completing the survey, 75 shillings each for the first two successful referrals, and 100 shillings for the third. Respondents recruited other people from their networks in successive waves of data collection. Referrals continued through as many waves as were necessary to complete the target number of interviews for each network. Our network analysis, which appears in our unpublished methods report, shows the patterns of homophily, that is, the tendency to recruit people with similar demographic characteristics to oneself. Among “Bungoma to Nairobi” migrants, for example, educated people were unlikely to recruit uneducated people (and vice versa).
RSA then conducted face-to-face interviews in the location and language (English, Kiswahili, Luhya, Bukusu, and Somali) chosen by the respondent. RTI cleaned and analyzed the collected survey data in Stata, using summary statistics and cross-tabulations to generate the findings presented in the following sections.
Although the potential biases of snowball sampling are minimized by RDS, the methodology still has limitations. For example, with RDS it is possible to oversample from discrete networks or clusters of individuals with similar experiences, such as from a similar educational program. Survey results from within a small cluster may indicate a high prevalence of a certain response, but in the final analysis, the result may not be representative of the general population. We tried to minimize this limitation by using a large number of seeds (10 from each county) and limiting referrals to three per individual.
Bungoma Respondent Profile
For the purposes of this paper, we focus on only those respondents who were born in rural areas of Bungoma County,[2] a predominantly agricultural region of Western Kenya. Bungoma County has a population of 1.6 million inhabitants, 53 percent of whom live below the poverty line (Commission on Revenue Allocation (Kenya), 2011). The county enjoys high rainfall, which fosters agricultural productivity, particularly in the maize and sugarcane sectors. Agriculture is estimated to account for up to 70 percent of jobs in Bungoma County, and youth unemployment is estimated at 60 percent (County Government of Bungoma, 2013).
The topic of this paper is to explore youth migration in relation to agricultural livelihoods; a separate paper could explore the differences between Bungoma and Garissa counties. We focus on Bungoma County for two main reasons. First, because of the agricultural nature of the county, it provided an opportunity to examine preferences about a specific livelihoods profile that is more reflective of the literature concerned with the exodus of youth from agriculture. Garissa is a pastoral county with less agricultural productive potential. Second, upon our initial review of the data across the two counties, it became clear that the migration experience is inherently different between them. Most notably, in the Garissa data, we noticed a high frequency of enrollment in postsecondary education programs.
Our sample consists of youth born in villages in Bungoma County who were living in Nairobi or Bungoma Town at the time of the survey. Bungoma Town is the county capital and second largest town in the county, with a population of approximately 55,000. Because our sampling process was based on the location of the respondents at the time of the survey, the profiles presented should not be interpreted as representative of all youth migrants born in Bungoma County.
Table 2 provides a summary of the demographic profile of these respondents. As we anticipated, most survey respondents come from rural households whose primary economic activity is agriculture- or livestock-related. Although we aimed for an even distribution of male and female respondents through the sampling process, the survey ultimately included 67 percent men. This could be attributed to more men being a part of our population of interest. Additionally, after the initial pilot, we determined that for females who had migrated exclusively to follow their husbands, many of our research questions were not relevant, so we included filter questions in our final survey to exclude that specific profile.
No accurate statistics exist for the domestic migration rate of youth in Bungoma, as these individuals are difficult to track and migration is fluid. A long-term panel study in Busia, a neighboring county, found that 55 percent of adolescents had left the county for a period of at least 4 months, and 28 percent were not currently living in the county 10 years after primary school (Miguel & Hamory, 2009). The 2009 census estimated that 4 million Kenyans (10 percent of the population) had migrated within the country (Government of Kenya, 2009).
Analysis
Migration Experiences of Rural Youth
Our survey captured a detailed history of each respondent’s migration since age 12. The mean age of first migration (the age at which they left their home village) is 20 years old and does not differ significantly by gender or education level of respondent. This aligns with most youth completing secondary education and accessing official identification documents (required for migration) at age 18. Among our sample of Bungoma County youth, 32 percent moved directly to Nairobi for their first migration, whereas 26 percent moved to Bungoma Town first (Figure 1 provides a map of Kenya and Bungoma County). Respondents had migrated an average of two times at the time of the survey.

The survey explored the duration of migrants’ “stays” in various locations to test the common perception that youth migrants are continually hopping from place to place in search of something better. Most migrants (81 percent) had planned to stay at least a year when they arrived in their current city or town; 51 percent had planned to stay indefinitely. Among those who had planned to stay less than a year, most ended up staying longer. Those who had made more than one migration (55 percent of respondents) stayed in their first destination for an average of 26 months. Note that many of these respondents (30 percent) were enrolled in education at their first destination, which could account for the duration of stay. (Education as a driver for migration is discussed in the next section.)
Among those living in Bungoma Town at the time of the survey, 19 percent had previously lived in Nairobi, indicating that Nairobi is not necessarily the final destination for these migrants. Returning to Bungoma Town, the capital of their home county, could indicate a desire to return closer to home—all respondents were born within approximately a 2-hour driving radius of Bungoma Town. Those individuals spent an average of 21 months in Nairobi before migrating again.
The movement of Bungoma youth is highly variable: of the 1,350 Bungoma youth surveyed, 729 (54 percent) had followed the 10 most common migration pathways, shown in Table 3. The two most common paths were birth village to Nairobi and birth village to Bungoma Town, respectively.[3] Interestingly, the path village–Bungoma Town–Nairobi was not among the most common. During focus group discussions, respondents described a phased migration pathway out of the village, spending time in smaller towns, then bigger towns (such as Bungoma Town) before moving to Nairobi.
Based on the most popular routes (village–Nairobi and village–Bungoma Town), it appears youth may separate into two categories: those who find what they are looking for in Bungoma Town, and those who target Nairobi from the beginning of their journey. Youth migrating directly to Nairobi may have been influenced by greater educational opportunities in Nairobi, as educational facilities are limited in Bungoma Town. Family connections in either location may influence migrating youths’ chosen destination.
Through the focus groups, we learned that many Bungoma migrants move between lakeshore towns frequently in search of the best-paying fishing activities. The focus group discussions also indicated that most youth migrants do not have a clear path plotted out in advance of migration, but rather obtain information and make decisions as they go.
Push and Pull Factors for Youth Migration Out of Rural Areas
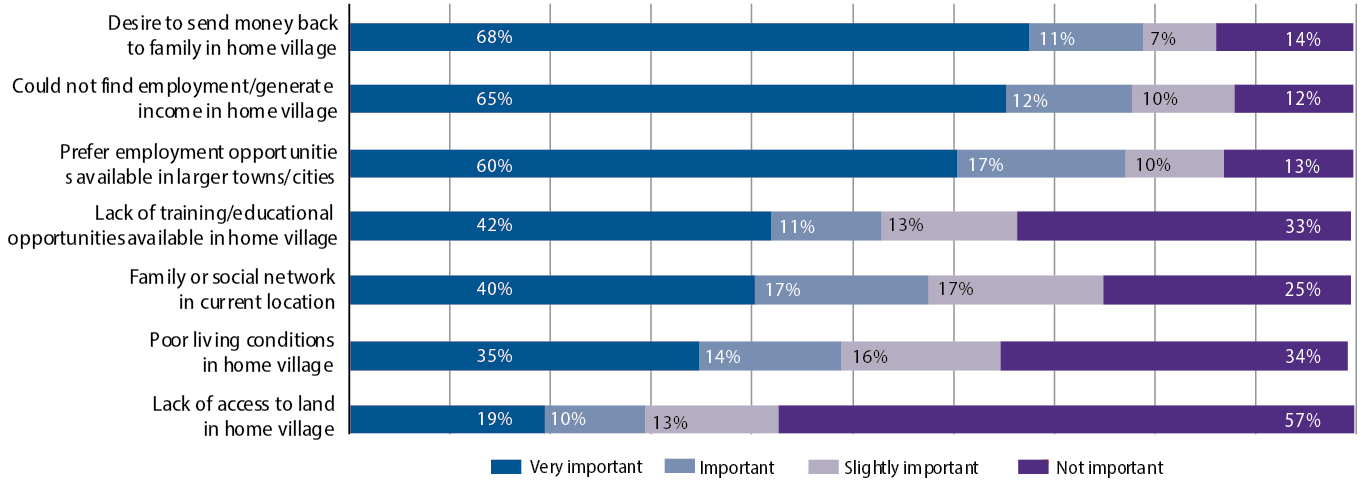
Among male and female migrants in both Nairobi and Bungoma Town, the top reasons for migration were to search for work, a job opportunity, and education. These findings align with prior studies (Kristensen & Birch-Thomsen, 2013; Miguel & Hamory, 2009). No respondents selected civil conflict, lack of land, lack of services, or drought as the primary purpose for their move. Consistent with Muyanga and colleagues (2016), 57 percent of respondents described access to land as “not important” to their decision to migrate from the village. As shown in Figure 2, more important factors included not being able to generate income in their villages, preference for employment opportunities in larger towns or cities, and the desire to send money back to their families.
The survey revealed that push and pull factors for youth were intertwined: the most common combination of factors was the lack of income-generating opportunities at home and the pull of potentially better income-generating activities in cities. Focus group discussion findings were consistent with the survey; most respondents cited job and education opportunities as factors driving migration. Sixty-eight percent of respondents said that it was very important to send money back to the family in the home village, indicating that migration is part of a family’s overall livelihood portfolio.
The focus group discussions also shed light on some specific push factors: some participants described village members’ victimizing unemployed male youths, as well as the simple scarcity of resources within poor families and the inability to support grown children. Focus group discussion participants in Bungoma also noted some hostility toward younger sons in families where there were large numbers of sons.
Although the youth we surveyed reported agriculture to be the primary economic activity in their home villages, wage employment and self-employment were equally common among young people (see Table 4).
Focus group discussion participants reported difficulty in finding jobs in their villages, noting that agricultural laborers are only needed during planting and harvest time. Examples of wage or self-employment in the villages included security guards, restaurant workers, M-Pesa (mobile money) shop agents, masons, and auto mechanics. However, focus group participants also noted deterrents to migration, such as a lack of networks in bigger cities and the costs and challenges of migration—specifically, the lack of transport and initial accommodation.
Planning for Youth Migration
The most important barrier to migration noted in the focus group discussions was the ability to raise funds needed to cover migration costs, such as bus fare, living costs for 1 to 3 months, and identifying initial accommodations. The survey confirmed these results and found no significant differences between male and female respondents. While youth may not plot out their migration journey, they do engage in some preparation activities; many respondents saved money (48 percent), looked for training programs (41 percent), inquired about job opportunities (66 percent), and identified housing (59 percent) in advance of migrating. These questions were not mutually exclusive, so youth could do more than one of the preparation activities. When asked what they consider the most important pre-migration activity and the one that they would recommend to friends interested in migrating, they listed, in order of highest recommended: saving money (35 percent), gaining training and skills (24 percent), and researching job opportunities (17 percent).
Perceptions of Post-Migration Challenges
During the focus group discussions, youth noted several challenges to their perceived success in migration. A common theme was the high cost of living and inadequate housing. They also mentioned difficulty in obtaining jobs (though the survey data indicate that many are finding work) and that the work they had obtained was not necessarily what they had envisioned. The focus group discussions elicited a dissatisfaction with wages and an inability to save income due to everyday expenses. Further, both young women and young men alleged exploitative labor practices. For example, several noted that they did not know the terms of their employment upon starting their jobs.
Employment Profile
Table 5 provides a summary of Bungoma County migrants’ employment experiences upon first migration and at the time of the survey. Among Bungoma males and females able to find a job, 60 and 52 percent (respectively) said that their first job after migrating was not what they had hoped to do. Thirty-four percent were able to secure a job immediately; another 56 percent found a job within 6 months. Thirty-two percent did not know what they would be paid before accepting their first job, and 50 percent said the salary was lower than they expected. Only 2 percent said their salary was higher than they expected.
Table 5 lists the most common occupations initially after migrating and at the time of the survey. Although there were small changes, we did not find evidence that certain types of occupations were significantly more common among youth who had just migrated.
Support to Family and Network in Villages of Origin
When asked about their pre-migration intentions, 67 percent of survey respondents indicated a desire to send money back to their family. Our data indicate that youths generally did provide remittances to their families back at home after providing for their own basic needs. In fact, 77 percent of youths indicated that they provide support to their family via cash, and 70 percent provide family via in-kind support (payment for sibling school fees, items from the city, etc.). Further, youths who migrated indicated an ability to support new youth migrants from their village of origin; 86 percent indicated they provided advice, and 78 percent provided connections with others in the urban areas. Additionally, 69 percent stated that they provided housing for new youth migrants from their village, and 73 percent provided financial assistance. Family remittances and support to new migrants indicate a community basis for migration, as well as continued social network ties to their villages.
Interest in Returning to the Village
When asked where they would like to move in the next 12 months, 41 percent of male survey respondents currently in Nairobi indicated they would move back to their village. Similarly, 76 percent of male survey respondents in Nairobi responded that they would like to return to their villages permanently in the future. Female survey respondents in both Nairobi and Bungoma were less likely than males to want to return to the village, and few males (12 percent) currently in Bungoma Town wanted to return to the village in the next 12 months, though more (51 percent) indicated an interest in returning permanently at some point in the future (Table 6).
Men who are currently married are also more likely than unmarried men to indicate an interest in returning to their villages. We looked for associations between respondents’ land ownership and primary economic activities with their desire to return to the village but did not find a relationship, most likely due to the lack of variation in those variables. We also did not find a relationship between respondents’ age and their answer to these questions.
The desire to return to the village could be a result of the migration experience not meeting expectations. The focus groups revealed that migrants experienced some surprises in terms of security concerns, low earnings, and expensive, low-quality housing. Some women noted concerns around immorality.
Female respondents largely did not indicate an interest in returning to their home villages. One focus group participant noted that since the devolution of government from national to the county level in 2013, opportunities in regional town centers have increased.
We explored respondents’ interest in returning to the village in relationship to their current employment, wages, and interest levels in various economic activities. Among males, 80 percent of those employed as watchmen at the time of the survey (the most common job for males) indicated a preference for returning to their village. Similarly, 72 percent of male casual workers said they wanted to return to their village. Key informant interviews in Bungoma Town indicated that those who return to the village are often those who cannot get jobs in the city, but the survey showed that unemployment in towns and cities is not associated with whether males plan to return home. Only 55 percent of currently unemployed male respondents planned to return to the village (and 61 percent of those who experienced unemployment in the last year), meaning that more watchmen or casual workers state an interest in returning to the village than do those who do not currently have a job.
Though our survey was limited in its ability to capture accurate wage data for respondents, we did ask them to estimate their average monthly pay within six broad pay categories. The median wage of those who plan to return to the village was higher than the median wage of those who do not, but the distribution of wages is similar between the two groups, so low wages do not seem to be a factor explaining youth migrants’ interest in returning home.
To test the common notion that youth migrants are not interested in agriculture, we asked respondents about their level of interest in the most common economic activity for young adults in their village. Surprisingly, among respondents who said the most common activity for youth in their village is crop farming, 77 percent responded that they are “very interested” in that work (Table 7). Response rates were similarly high for livestock keeping (64 percent) and a combination of crop farming and livestock keeping (68 percent). Furthermore, 65 percent of men and 42 percent of women had returned to their village for agriculture-related work within the year preceding the survey.
We also surveyed respondents about what types of training they would be most interested in. Among male respondents from Bungoma, the most common response was training in driving or trucking (35 percent), though that figure was slightly lower for those who indicated a plan to settle in their home villages (26 percent). Business management and computer or information and communications technology training were the next most common responses. Few Bungoma men responded with interest in agriculture-related training. Even among those with plans to settle in their home village, only 6.3 percent indicated an interest in training related to farming, agribusiness, or agro-processing.
We found mixed evidence supporting whether the purpose of migration was linked to a desire to reinvest in the farm or other rural livelihoods. In the focus group discussions, we heard that youths migrate to earn the money needed to invest in farm inputs. The focus groups also revealed that youth migrants borrow money to invest in land in or build houses in their villages. On the other hand, only 5.4 percent of survey respondents were saving money to return home (an additional 3 percent were saving to buy or develop land or build a house but did not specify whether in their village or elsewhere).
Discussion and Conclusions
Our survey results show that many youth who migrate from predominantly agricultural areas have plans to return to their home villages and are interested in agriculture. This finding was surprising in light of existing literature and the commonly held assumption that youth are abandoning agriculture and rural life. It further highlights that for some, migration to more urban areas is a phase in life. Interestingly, our survey results around preference for agriculture also differed from the findings of our focus group discussions, which echoed the literature: focus group participants described agriculture as “dirty work,” for “old people,” and “an old way of investing.” This underscores the importance of using mixed methods that include sufficient sample size to draw conclusions.
The literature points to land access as a factor that deters Kenyan youth from agricultural livelihoods (Mwangi et al., 2016; Njenga et al., 2012; Noorani, 2015; Osti et al., 2015; Oucho et al., 2014) but does not link land access to migration. Our data indicate that access to land is not a driving factor behind youth migration out of rural areas. Further, only 16.5 percent of survey respondents indicated they would return to their village if they were to inherit land. Focus group participants noted that in Bungoma, youth from households with sufficient land tend not to migrate; if youth are entrepreneurial or profitably engaged in farming activities, they remain in the village. Our survey data show that access to land is not a factor driving out-migration, and we find that out-migration does not mean that youth are abandoning agriculture—many are very interested in agriculture, and most young men plan to return to the village.
While we do not know whether these youth will follow through on their plans to return to the village, their stated interest in agriculture could be harnessed for a productive contribution to the agricultural workforce. Very few survey respondents were currently employed in agriculture-related activities (though many return home for seasonal work); most are watchmen, casual workers, or unemployed, suggesting a mismatch between their interests and skills and their contribution to the workforce.
Programs aimed at engaging youth in productive employment in agricultural value chains should consider how to tailor support for this specific cohort that may offer unique skills (based on their agricultural origin and desire to return to the village) and connections to rural areas and—if their plans come to fruition—may return to agricultural livelihoods in the future. More information on individuals’ specific goals would be required to identify what resources would best support them in their return to the village. Because many seem interested in owning land, key resources could include entrepreneurship training, access to land or land rights, access to appropriate financial services and agricultural inputs, training on end market quality standards and supply chains, or training in collective bargaining skills.
While conducting this research, we asked ourselves, What conditions enable one person to move, while others are constrained? What keeps people in certain places? We recognized that for many youth, family pressures (both negative and positive) pushed them to leave their home villages. That said, not only was their practical preparation limited primarily to earning enough for the initial migration, youth migrants also lack social or emotional preparation. Youths in the focus groups indicated that they would have liked more emotional support and regular communication with family members.
Overall, this research indicates that youth migration should be seen as fluid rather than static. While many youth continue to move from city to city, others return to home counties and home villages. Policy makers, service providers (skills building, training, family planning, etc.), employers, and development practitioners should engage youth using methods that recognize the mobility of this set of individuals.
What might this look like? Training institutes could offer courses that could be started in one location and finished in another. Family planning and life skills providers could employ a more targeted case management approach using a central database: technology innovations make this feasible even in rural areas. Employers may consider casting a wider net while searching for young employees. Given that many youth take 6 months to find a job and change jobs multiple times, basic household budgeting skills could benefit them in terms of motivations to migrate, keep a job, attain new skills, or save money.
Development practitioners should recognize that geographic intervention sites could be broader than geographically focused outcomes. For example, implementers of activities focused on growth of the agricultural sector in Bungoma may consider recruiting Bungoma migrants in Nairobi. They might more carefully consider the flow of remittances between Bungoma migrants and their family back home and target migrants as the purchasers of new types of seed or fertilizers that they can bring back home to their family members.
Finally, a key takeaway is that migration is inevitable for a subset of the youth population in rural areas in these counties in Kenya, and it should not be viewed with a negative lens. Research indicates that young adults are part of complex household and community resilience mechanisms. However, they lack the foundational and ongoing support to achieve what they visualize for themselves. This should be an area of interest for both policymakers and development implementers.
Suggestions for Further Research
This study provides insights into a specific, hard-to-reach youth subpopulation—those born in agricultural areas who migrate to large towns and cities—that is often missed by research and development activities. Additional research could further inform policy and implementation in the following areas.
Returning to Home Villages
Although the data indicate that most male youth migrants are interested in agriculture and plan to return to their villages, we cannot draw conclusions from this dataset about how many follow through on these stated plans. Further research that follows youths over time and that continues to trace their migration and employment pathways would be required. Most youth who express interest in returning to their village within 12 months are currently working in jobs with limited growth potential (watchman, casual laborer). The promises of county-level growth due to devolution have also been cited as potentially enticing young adults to return from Nairobi.
Household and Community Resilience
Most of our respondents support their families in their home villages, with many also supporting additional youths from those villages both financially and as mentors. The focus group discussions also indicated a strong connection to the village of origin, with many participants noting that they preferred the social networks and community support to the isolation of urban areas. Research could be conducted on the food security and economic profiles of the village families and communities and whether such support enables households and/or communities to better absorb or adapt to shocks and stressors. Researchers could look into the cyclical nature of generations of young men migrating between home villages and urban areas. Finally, more research could be done on the social pressures pushing young migrants toward a perception of success vis-à-vis remittances and gifts and what perception they face if they return to their village permanently.
Gender Considerations
Our study used the same tool for both male and female youth migrants. Given that so few women indicated interest in returning to their home villages, as well as differences in woman’s migration profiles (e.g., migration for marriage), further research using gender-specific surveys would better illuminate the migration experience of females. Focus group discussions noted that both young male and female migrants noted the potential for sexual exploitation as being an issue that young women frequently face. Women also noted that returning to their home village would be more difficult if they were perceived to have turned to prostitution to succeed in the city. Additional research is needed to understand the specific risks young women face, as well as societal pressures such as hierarchy and respect for elders, among others, that increase vulnerability for female migrants.
Countering Violent Extremism
Literature on countering violent extremism in Kenya highlights the importance of social networks, relationships between civil society and the public sector, and intergenerational support as increasing community resilience to radicalization (International Alert, 2016). The focus group participants noted that many youth would like greater communication with their parents and community back home. While this study was not focused on issues of violent extremism, respondent-driven sampling may be a way in which to better learn about youth moving into specific crime hot-spot neighborhoods—such as Eastleigh, Nairobi—and what types of support they would need from their social networks, the government, and elders in their community.
Biases associated with chain referral sampling are derived from the choice of the initial sample, volunteerism, differential recruitment (some groups recruiting more referrals than others), and homophily. Respondent-driven sampling imposes quotas to minimize initial sample bias and offers incentives to minimize volunteerism bias (Heckathorn, 2002).
Data from both Garissa and Bungoma will be included in a forthcoming paper on the use of RDS methodology for this study. Additional papers or outputs may include a focus on Garissa youth.
This is largely attributable to our sampling strategy, which required that respondents currently reside in Nairobi or Bungoma Town.