


Definitions of Terms as Used in This Paper
Data: The full set of measures available to measure country-level economic growth.
Indicator: The individual numbers related to a specific, measurable output such as gross domestic product (GDP), exports, or research and development (R&D) spending.
Index or indices: The combination of weighted indicators that provides a high-level overview of a thematic area, such as innovation or human development.
Background
In the competitive global economy, innovation in development of new products, processes, and services is essential for achieving country-level economic development. An innovation-focused economy builds capacity for a nation to develop and export higher-value products, use resources more efficiently, and create wealth domestically. For a nation to compete in the global innovation marketplace, it must develop diverse and interconnected assets including research and development (R&D) output, an educated workforce, stable governance, a business-friendly environment, accessible capital, and a culture that supports innovation and risk taking.
Innovation can have an incremental or disruptive impact on economic growth. Rostow exemplifies a traditional view of economic history, specifying a fixed trajectory of incremental economic development (Rostow, 1960). In his model, the five stages of growth for an economy are (1) a traditional society, (2) preconditions for take-off, (3) take-off, (4) drive to maturity, and (5) age of high mass consumption. These advances occur through improvements in institutions, efficiency, and technology, which allow for greater return on investment from advanced industry.
An alternative view, inspired by the theories advanced by Schumpeter (Schumpeter, 1942), argues that the creative destruction spurred by innovators and entrepreneurs drives economic transformation, displacing established firms and counterbalancing monopoly power. Nelson and Winter in their framework of “evolutionary economics” claim that the neoclassical concept of equilibrium is unattainable, and because of the nature of economic cycles, economic development requires constant innovation and adoption of new technologies and practices (Nelson & Winter, 1985). Nelson and Winter emphasize that innovation is a means to an end and an ongoing process in support of economic transformation.
Whether the trajectory of innovation-led economic growth is incremental or disruptive, it is a priority in the economic development strategies of low-, middle-, and high-income countries. Low- and middle-income countries see innovation as a key to global competitiveness, a way to avoid the “middle-income trap” and provide better employment opportunities to improve income and reduce poverty. High-income countries invest in innovation to remain on the forefront of global economic trends. By using data to assess the state of innovation-led economic growth at a country level, researchers and practitioners can illustrate the various factors that combine to transform innovation into economic output.
Motivation for Developing the Tool
RTI developed a data visualization tool that consolidates country-level time-series data and presents it in graphical form to enable researchers to visualize and quickly understand high-level national trends in innovation. The tool is intended to provide an understanding of time series indicators related to a country’s innovation economy. It serves as a bridge between broad, global reports like the Global Innovation Index (GII) and highly detailed country-level reports on innovation policy. The tool is a starting point for further research into a country’s innovative capacity and trajectory in using innovation as a tool for economic growth. The target audience for the data tools is a researcher or project manager seeking to observe country-specific trends and comparisons that might suggest important considerations for policies or programs.
In creating the database that underlies the data visualization tool, RTI drew upon data available from governments, nongovernmental organizations (NGOs), multilateral agencies such as development banks, and think tanks, that compile national indicators to assess economic development.
Data Background
In assessing national capabilities in innovation, analysts often use indices, which can provide a quick way to rank countries and evaluate how they perform at a high level. Indices are composite scales or rankings, typically based on societal/economic data, that are indicators of the “innovation readiness” of a country or economy. Such indices include the Global Entrepreneurship and Development Index, the ease of doing business index, and the Global Innovation Index, produced by respected international organizations such as the World Bank and the World Economic Forum. They are useful tools for gaining a high-level understanding of countries’ economic performance related to innovation. They are scrutinized intensively by policy makers and researchers, but as Acs, Szerb, and Autio point out in their annual index of entrepreneurship, these indices focus on aggregates of high-level data and may not highlight important nuances and data patterns at a firm or individual level (Acs et al., 2016).
Acs and colleagues recommend that researchers and policy makers conducting a country-level diagnostic evaluation of entrepreneurship or innovation break out the individual dimensions of the index and compare them to peers and global benchmarks over time. By complementing existing indices with time series and cross-sectional data on individual indicators, researchers can begin to understand time trends and momentum in individual dimensions of the innovation ecosystem and improve their understanding of the state of the innovation economy.
To facilitate this base-level perspective of a country’s readiness to innovate, RTI researchers compiled an extensive set of indicators using data available from publicly accessible sources. We then transformed the indicators into data visualizations, data dashboards, and basic analysis tools, which show how indicators interact over time at a country level and across countries. Together, this tool’s visualization capabilities allow researchers to quickly view time trends and hypothesize about relationships to other policies or actions. It is not intended to replace the many existing indices related to innovation and economic growth but rather to complement them and provide insight related to one or more policy measures.
In creating the data visualization tool, our research team began by identifying the data most relevant to innovation-based economic development. Data sets from the European Union, the World Bank, the Organisation for Economic Co-operation and Development (OECD), the United Nations Educational, Scientific and Cultural Organization (UNESCO), global patent offices, and other governmental organizations and NGOs aggregate statistics on science and technology innovation. While various indices and rankings exist, we looked at three global innovation publications to inform our understanding of existing resources. We focused on those that were not region-specific (such as the European Union) or limited to a small subset of countries (such as the OECD).
Indices from the World Intellectual Property Organization (WIPO) (Dutta et al., 2017), the Information Technology & Innovation Foundation (ITIF) (Ezell et al., 2016), and Bloomberg (Jamrisko & Lu, 2017), offer different perspectives on how to measure an innovation economy. They provide insight into the ways that thought leaders attempt to quantify innovation capabilities. Each of these indices, outlined in Table 1, draws on a mix of public and private data sources that track national economic measures and policies related to innovation and economic development.
The Global Innovation Index (GII), produced by Cornell, INSEAD, and WIPO, ranks 127 countries based on 82 indicators, generated from the most recent 10 years of available data. It compiles data from the World Bank Data Indicators, UNESCO Institute for Statistics, United Nations, European Union, World Economic Forum, and others. It compares countries across seven elements and creates indices for each of the seven, evaluating strengths and weaknesses in each national economy. It then indexes and ranks all countries based on innovative performance. Additionally, the GII annual report includes a high-level thematic discussion, which observes global and regional trends in innovation. The WIPO GII report is written for an academic and policy-focused audience.
The ITIF report is more detailed than the GII and focuses specifically on 27 indicators to evaluate 56 countries, which it groups into “contributors” and “detractors” to the global innovation economy. While some of the indicators are statistical (such as R&D spending as a percentage of or gross domestic product, or GDP), others are policy-specific, such as a protectionist trade policy or a Bayh-Dole style intellectual property law. The report differs from the GII because it argues that certain countries are net detractors from the global innovation economy, contributing less than they take from other countries. They roughly group innovators into different economic models, depending on the levels of state intervention and business activity related to innovation. The authors are critical of protectionist trade policies and weak intellectual property protection, arguing they provide a negative net benefit to global innovation.
Bloomberg’s Innovation Index is similar to the GII but offers a more simplified ranking of 50 countries using seven indicators. Bloomberg’s index includes only countries with data available for at least six of the seven indicators and narrows its reporting to the top 50 countries. It is an example of a more simplified view of global innovation for a broader, less academic audience.
The GII, ITIF, and Bloomberg reports come to many of the same conclusions: the top performers in the global innovation economy are concentrated among the wealthiest countries in Western Europe, along with the United States and advanced Asian countries including Korea, Singapore, and Japan. In these compiled rankings, countries in Latin America, Africa, and South Asia do not perform as well. Each of the methodologies produces different results for emerging countries. The GII ranks China as a top performer (25th of 128) because of its high levels of innovation output, but the ITIF ranks it toward the bottom (44th of 56) because the authors claim restrictive intellectual property and trade policies detract from its capacity to innovate on a global scale. Additionally, the GII and ITIF reports agree that countries like Argentina, India, and Thailand are among the worst performers in global innovation, but there is little discussion of the types of specific policy shifts or investments that those countries can prioritize to improve their position in the rankings.
Each index weights certain indicators differently, favoring one model of innovation-led economic development over another. The rankings depend on how the authors weight public and private R&D investments, human capital, policy environment, patent production, skilled immigration, entrepreneurship, or others. However, as the ITIF acknowledges, it is important to consider that different countries follow different models of innovation. Not all countries can or desire to follow a model of development like that of Norway, South Korea, Japan, or the United States, and economic development leaders in each country may work within different values, cultures, industries, and resources that will influence their innovation policies.
RTI’s Data Tool and Methods
The RTI innovation indicators data tool and underlying dataset serve to illustrate time trends and momentum related to innovation and are intended to inform questions on how policy and culture might affect national innovation dynamics. The data tool builds on existing data repositories, organizing and structuring data to allow a user to access the information more readily, while providing enough detail for users to ask more informed questions. The tool allows users to observe trends in changes over time by looking at interactive, side-by-side comparisons among peer countries and regions. It offers a combination of data transparency, data detail, and wide coverage. The data tool fills a research gap by providing users with a series of specific, detailed indicators that offer a next step for a researcher, after seeing an index or ranking, to view time trends and understand different models of innovation-led economic development.
RTI’s data tool is not intended to replicate large data repositories whose purpose is to store and query country-level data, such as the World Bank World Development Indicators and the UNESCO Institute for Statistics data platform. Additionally, the tool is not meant to provide a single answer or one-size-fits-all solution to the question of how innovation is an element of economic growth. It begins with the argument that innovation is a tool for economic transformation, but does not advocate for a specific roadmap or theory of how innovation leads to economic development. Instead, using the tool is a first step for framing questions about the types of policies and actions that influence a country’s innovative outputs and the types of activities countries can undertake to improve economic transformation through innovation.
RTI’s data tool is built on four dimensions of an innovation economy:
-
Human capital: A talented pool of creative, inventive people with flexibility to adopt and adapt to new ideas
-
Idea flows: Culture of openness to new ideas (regardless of the source)
-
Research inputs: Public- and private-sector investments in innovation
-
Entrepreneurship: Stable public and private environment that facilitates and supports new venture formation and operation
These dimensions are inputs leading to the overarching goal of economic transformation.
Each of the data indicators in Table 2 can be related to the broader innovation story. They are the result of an analysis of literature, existing indices, and data tools and insights from experts in the field. These indicators represent a consolidated set of information, which we evaluated to be the most relevant of a larger list of data indicators compiled in the appendix.
Each indicator is available over a time series and shows trends over the most recent 20 years available. They are displayed in a way that is meant to guide further research into policy and culture using more detailed national and regional data by addressing questions such as the following:
-
How and why has a country’s profile of exports and economic output changed over time?
-
Is a change in inequality or economic opportunity for women occurring because of innovation?
-
What factors make a country’s population educated? Creative? Inventive?
-
Is a country open to connectedness to global innovation including global patents, international trade, or sharing of intellectual property? If not, why not?
-
How is a country investing in research, and is it effective?
-
Does a country have an environment that encourages entrepreneurship? What barriers exist to new venture formation and growth?
-
Do these characteristics lead to changes in the labor force or economic output?
For these and other research questions, the data tool provides visualizations and time series comparisons to begin the research process.
Data Tool Overview
To visualize the data, RTI used Tableau Desktop,[1] a user-friendly, interactive data visualization tool that allows users to embed custom dashboards into websites, export them, and print them. The data dashboard itself is available at https://tabsoft.co/2ruNUTk. It is separated into tabs to provide different visualizations to the user, and its drop-down menus enable a user to select countries individually.
Researchers can use the tool to quickly analyze the different innovation dimensions and compare countries on innovation-led economic growth. The tool is intended to streamline the process of identifying, gathering, cleaning, and visualizing data indicators and trends for researchers pursuing new projects and opportunities. The data tool can display momentum in innovation capacity and illustrate changes over time, which can help researchers formulate questions such as the following:
-
How does a country compare with its peers or global competitors? What policies, industries, economic assets, cultural aspects, growth trajectory, etc. influence the country’s innovation trajectory?
-
What innovation inputs have changed over time, and was there a specific policy change or event that changed those inputs?
-
Of the multiple dimensions (investments, human capital, universities, policy, industry), how is a country performing compared with its peers? Is one dimension changing significantly over time?
-
Are there particular years when innovation outputs exhibit extreme growth or stagnation? Can country-level policies be tied to these data?
-
What types of innovative paths have certain countries taken to reach their current state of economic development?
The time series data provide insight into the momentum of key indicators and can offer clues to shifts in policy or innovative output. Analyzing these data is a quick first step in identifying key talking points or benchmarks that will inform discussions with potential clients or partners in a country or region. Using this information, a researcher can then explore the various factors that account for a country’s past, present, and future trajectory of innovation and economic growth.
Applying the Research
The data tool is intended to be applied as a starting point for research into a specific country’s or region’s economic growth trajectory through innovation. It can provide benchmarking of trends over time, show significant spikes or changes in innovation inputs and tie them to policies, and illustrate certain hypotheses related to innovation-led economic growth. Using the data visualization, researchers can form targeted research questions or explore specific policies or economic shifts that contributed to a country’s state. We describe here three examples of applying the tool to policy questions at a high level to inform further research.
Benchmarking Trends Over Time
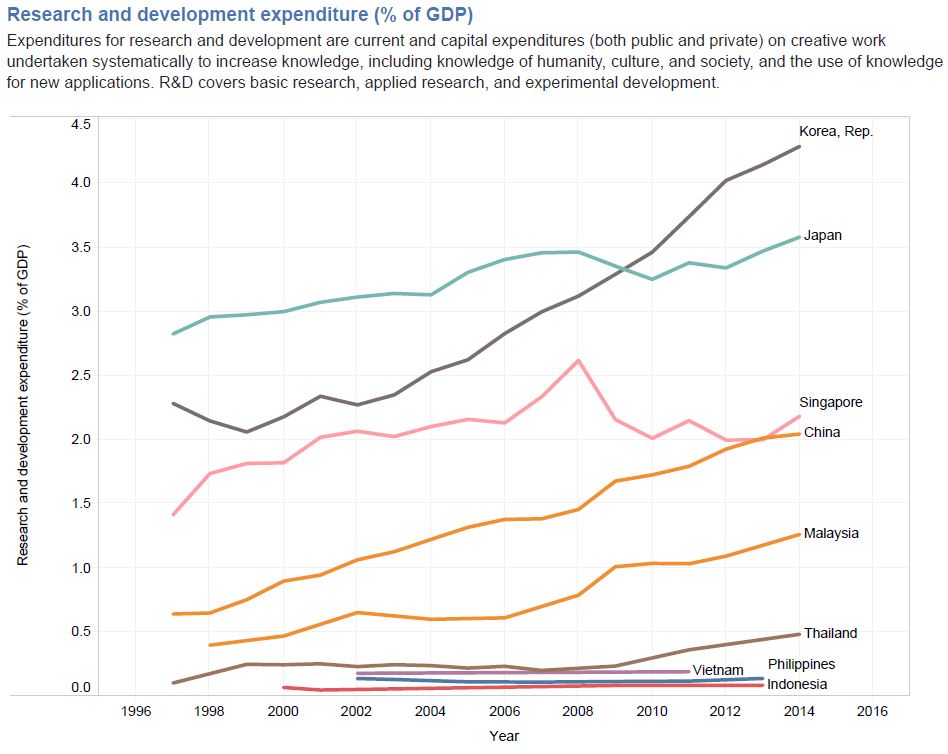
East Asian countries such as Japan, Singapore, and South Korea are models of innovation-led economic growth. Their extensive investment in R&D has led to high-tech exports and income growth over the last half century, making them global success stories for innovation. Today, many of their peers, including China, Malaysia, and Thailand, are trying to follow a similar trajectory. Looking back to the 1990s, Figure 1 illustrates that Japan and Singapore had a continuous high level of investment in R&D, measured as a percentage of GDP. In recent years, South Korea (referred to as the Republic of Korea in the data tool) has nearly doubled its R&D investments, indicating a shift to a culture that values investment in R&D.
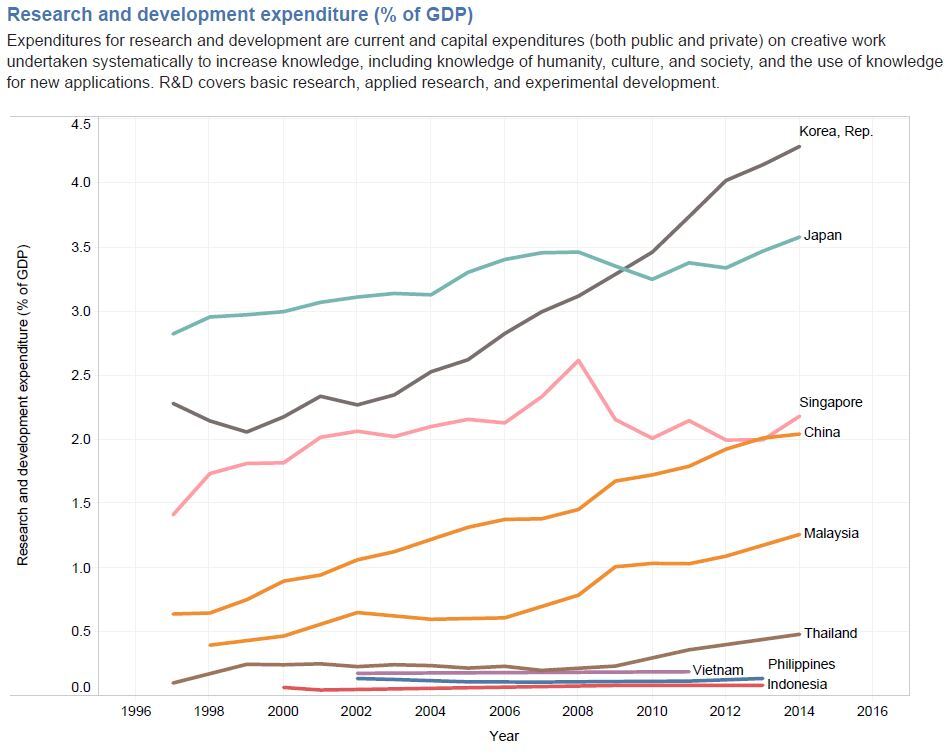
Newcomers like China, Malaysia, and Thailand have increased their investments in R&D significantly since 2000, making them new innovators on the global stage. Viewing the most recent data, a researcher might believe that China’s R&D spending as a percentage of GDP rivals that of its neighbor Singapore, but the time trend shows a longer-term investment strategy in research in Singapore. At the same time, the sharp increase in spending as a percentage of GDP is even more notable when considering China’s rapid economic growth since 1997. Malaysia’s R&D inputs increased sharply after 2005, partially because of shifts in the government’s economic policies. For a researcher looking at innovation in Asia, these data can serve as a starting point for guiding country-level research questions related to innovation.
Identifying Relevant Inputs Tied to Policies
As demonstrated in the previous example, Malaysia is becoming more engaged in the competitive environment for innovation in Southeast Asia. Malaysia’s growth in innovation inputs since 2008, as shown in Figure 2 (screen shots from the data tool), is likely the result of this more deliberate government support for innovation. A researcher might hypothesize that increases in R&D expenditures, increases in researchers, and a spike in patent applications and published journal articles can all likely be attributed to government ministries’ push to invest in innovation. However, as the economic growth indicators (charts in Figure 2b) show, these increases have not resulted in spikes in economic growth, which has remained relatively steady since 2010.


These numbers suggest that Malaysian support for innovation has been high in the past 10 years, but its next step is to discover how that momentum translates into economic indicators, including GDP growth, to improve the country’s overall well-being.
Illustrating Hypotheses About Country-Scale Innovation
Along with benchmarking and observing relationships among indicators over time, users can examine correlations among multiple indicators to illustrate how investments in innovation affect the economy across countries. Although these data are insufficient to show a causal relationship, they can begin to inform a discussion about investments in innovation. One example is to compare GDP per capita, a measure of national economic performance, with the density of researchers in R&D across countries. Additionally, the median[2] number of patent applications per capita offers insight into the inventiveness and human capital capacity of the country. The scatterplot in Figure 3 shows a positive correlation (as well as several outliers) between GDP per capita and density of researchers in R&D. Resource-rich countries like Kuwait and Qatar enjoy high levels of economic performance with little investment in R&D. On the other extreme, countries like South Korea and Israel have moderate to high economic performance with outsized investments in R&D personnel.
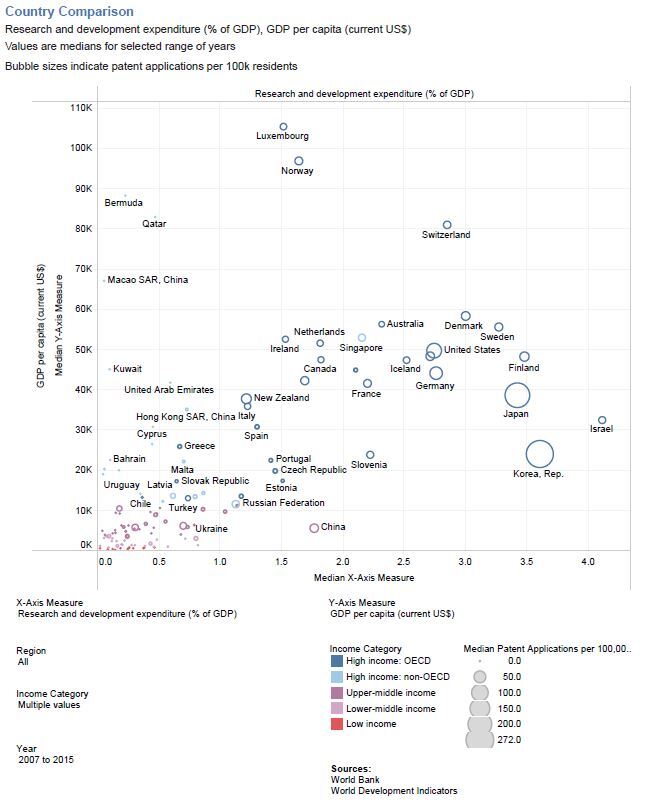
Scatterplots generated by the data tool show how certain indicators are correlated and roughly illustrate which countries are leading versus lagging performers in innovation based on selected economic factors. The scatterplots also help researchers formulate questions about why certain countries are lagging while others are leading and what these countries can do to improve the relationship between innovation and economic growth.
None of these visualizations or analyses are intended to be definitive or prove a causal link among indicators. Rather, they serve as a starting point for more in-depth analysis of a country’s economic performance and related policies, practices, and investments related to innovation.
Next Steps
The data tool provides a first glance at high-level trends in innovation at a country level and is not intended to be a definitive assessment of a country’s innovation ecosystem. When coupled with additional research and understanding of institutions, transactions, and culture within an innovation ecosystem, it can provide a useful insight for stakeholders looking to invest in a nation’s innovation ecosystem. Additionally, it can facilitate research by offering an organized method for analysis.
Despite the large amount of information that can be gleaned from RTI’s innovation indicators and data tool, this quantitative approach has limits. The data are from a national perspective and do not account for regional or provincial policies related to innovation. Many countries follow different models of innovation for economic growth. For example, some may focus on process innovation for advanced manufacturing, while others may focus on innovative R&D for technology transfer and licensing, which is not captured as easily in a single indicator. A country’s cultural disposition toward risk taking could inhibit or catalyze innovation-led economic growth. Furthermore, the strength of relationships among different actors, such as government, academic, and private-sector institutions, could explain some of the variation in the indicator data.
To address these research gaps, RTI is developing qualitative protocols to clarify these aspects of a country’s innovation ecosystem; these protocols will allow researchers to better understand the external factors that drive the numbers presented by the indicator data. A systematic approach that combines quantitative and qualitative data is needed for an informed conversation about innovation and economic growth.
Appendix. Data Indicators Evaluated
We evaluated the following potential indicators in creating our final list of data. To build the innovation indicators database, we excluded indicators that had low coverage or were redundant of another indicator. Additionally, we chose not to include the results of World Economic Forum’s executive opinion survey or World Bank’s enterprise surveys because of potential biases in subjective answers.
*Tableau Desktop is a product of Tableau Software Company, a Seattle-based software company that specializes in business intelligence data visualization tools. It is a product of commercialization of research by Stanford University’s Department of Computer Science.
†Indicators are not readily available for every country for every year of analysis. This limitation is due to reporting lags and the timelines of different national statistical agencies. Using the median number over a 5-year period allows the visualizations to account for these reporting differences.