Introduction
A commonly cited definition of mixed methods research (MMR) comes from Johnson, Onwuegbuzie, & Turner (2007):
MMR is the type of research in which a researcher or team of researchers combines elements of qualitative and quantitative research approaches (e.g., use of qualitative and quantitative viewpoints, data collection, analysis, inference techniques) for the broad purposes of breadth and depth of understanding and corroboration. (p. 123)
Jennifer Greene added that using multiple methods of inquiry increases one’s understanding of complex phenomena by making possible “more than one way of knowing” (as cited in Johnson et al., 2007, p. 119). It has been suggested that, within the field of evaluation in particular, MMR has been adopted more quickly due to the “very practical nature of evaluation research and the need for multiple sources of evidence when judging social programs” (Johnson et al., 2007, p. 116). Indeed, in recent years, funding agencies have encouraged MMR studies that combine qualitative and quantitative methods. The US Department of Education increasingly requires a mixed methods approach for program evaluations. Mixed methods also figure prominently in technical guidelines offered by major public and private funding entities, such as the National Institutes of Health, National Science Foundation, and Robert Wood Johnson Foundation (Creswell & Plano Clark, 2011).
Despite increased attention to MMR, detailed information on the procedures researchers use to collect and handle qualitative data is needed (Miles et al., 2014; Richards, 2015). Empirical articles often describe qualitative procedures in general summaries of just a few paragraphs. This is presumably due to limitations academic journals place on the length of articles but also perhaps because few clear conventions exist for reporting qualitative methods (Miles et al., 2014; Richards, 2015).
Empirical studies published in methodology-oriented journals provide in-depth information on particular aspects of a study, such as strategies for integrating qualitative and quantitative data (Castro et al., 2010; Jang et al., 2008) or organizing coded data into themes (Bridwell-Mitchell, 2012). However, the research community needs more examples, particularly of the methods researchers use to mix the qualitative and quantitative strands across multiple steps of the research process (as seen in Combs & Onwuegbuzie, 2010). In addition to allowing one to verify the quality of the research and the conclusions drawn, clear and detailed descriptions of procedures help readers and other researchers understand MMR and the intricacies involved in using both qualitative and quantitative data together in one study (Miles et al., 2014). It can also give researchers ideas for methods to use in their own studies.
In this paper, I provide a detailed description of the qualitative data collection and analysis methods used in a team-based, rapid-turnaround mixed methods evaluation study of science, technology, engineering, and math (STEM) high school education. I provide an example of a methodological approach used in practice that can be replicated by other researchers embarking on similar large-scale, multisite studies. Figures presented in this paper are excerpts of the actual matrices used for analysis.
While the overall study addressed several aspects of program implementation and its impact on student outcomes, as well as collected qualitative and quantitative data using multiple different instruments and informants, the focus of this paper is on one main finding that came out of the qualitative school staff interviews: student engagement was positively influenced by the program’s engaging instructional strategies.
This finding was important for several reasons, particularly because it helped the research team decide what to examine subsequently within the quantitative data sources. The construct “engaging instruction” was measured across multiple qualitative and quantitative data sources (including such concepts as collaboration among students, group work, and problem solving), making it ideal for illustrating the integration of qualitative and quantitative data sources throughout the study.
The research team (of which I was a member) employed an iterative approach to qualitative data analysis that combined the matrices analysis strategies outlined by Miles et al. (2014) with the qualitative data analysis software program ATLAS.ti and Microsoft Excel. This approach yielded several practical benefits for handling large amounts of qualitative data in a team-based setting:
-
Produced high-quality results in an efficient, timely manner;
-
Allowed analysts to select the software best suited to the task at hand; and
-
Facilitated work with team members unfamiliar with highly technical qualitative data analysis software programs.
Selected preliminary results illustrate how this approach can
-
help simplify the qualitative analysis process;
-
aid analysis and interpretation within and across cases; and
-
facilitate the integration of qualitative and quantitative data analysis, particularly through the production of quantitized data (that is, representing verbal responses numerically, Sandelowski, 2000).
Methods
STEM Study Design and Purpose
The Redesigned High Schools for Transformed STEM Learning (TSL) study was a formative and summative evaluation of a sample of 10 high schools involved in the North Carolina New Schools (NCNS) network. The NCNS is an educational initiative aimed at transforming teaching and learning in math and science for students at risk of dropping out of high school. NCNS schools follow a variety of school models: STEM schools that were redesigned traditional high schools, early college high schools (ECHSs) with a STEM focus, and New Tech Network (NTN) schools focused heavily on problem-based learning. Through this initiative, small schools (those with fewer than 300 students) were designed to help motivate students to become active learners by incorporating more critical thinking and applied problem-solving skills into classroom instruction.
Our research team used a multiple case study design (Stake, 1995; Yin, 2003) to collect and analyze data. The goals of the study were to
-
examine student learning (e.g., performance, course-taking) and motivation (i.e., participation, engagement, interest) using student surveys and existing administrative data, contrasted with student outcomes in a matched set of comparison students from 10 traditional high schools, as part of an impact evaluation; and
-
describe school-level policies and instructional practices used to promote student learning through semistructured qualitative interviews with school and district staff, partner organizations, and student focus groups; structured classroom observations (standardized coding instruments completed by the evaluation team); and teacher instruction logs (brief quantitative web surveys completed by teachers) at each school as part of the implementation evaluation.
Mixed Methods Approach and Rationale
As outlined in Creswell and Plano Clark (2011), much of the literature on MMR dates back to the late 1980s and early 1990s, when researchers from diverse disciplines published works defining and describing MMR, including work by Creswell in the field of education. While the definition and description of MMR are still evolving, Creswell and Plano Clark define MMR through a set of core characteristics common among studies that use an MMR design, including collecting and analyzing both qualitative and quantitative data in a way that allows one to integrate the two forms of data to address research questions formulated for a mixed method design; prioritizing one or both forms of data; and framing the study within a philosophical perspective that guides the research (p. 5). The mixed methods nature of the TSL study is described below using this source as a framework as well as specific MMR study design types outlined in Creswell (2015).
Of the major mixed methods study designs described in Creswell (2015), the TSL study most closely approximates a convergent intervention design, whereby qualitative data were embedded into a quantitative program evaluation study for the purposes of providing a more complete understanding of the problem through the examination of both general trends (from the quantitative data) as well as in-depth perspectives of participants (from the qualitative data). While the primary purpose of the study was to determine the impact of the program on student outcomes as measured by quantitative data sources, mixing the quantitative and qualitative strands provided the opportunity to examine corroboration and convergence of findings across multiple types of data sources. The results of the quantitative statistical analyses could also be explained, clarified, illustrated, and augmented from the qualitative strand. Furthermore, a program implementation rating scale integrating components of quantitized qualitative data (from the staff interviews) and quantitative data (classroom observations and student surveys) informed analyses of the quantitative student outcome data for the impact evaluation.
Qualitative and quantitative data were collected concurrently. Initial analyses of qualitative and quantitative data proceeded independently, but then the results of the qualitative analysis informed later stages of the quantitative analysis before the overall interpretation phase for the study. I discuss the analytic process in more detail in subsequent sections. The TSL study reflects a pragmatic philosophical perspective, drawing upon both deductive and inductive reasoning to best address the research questions in a practical way.
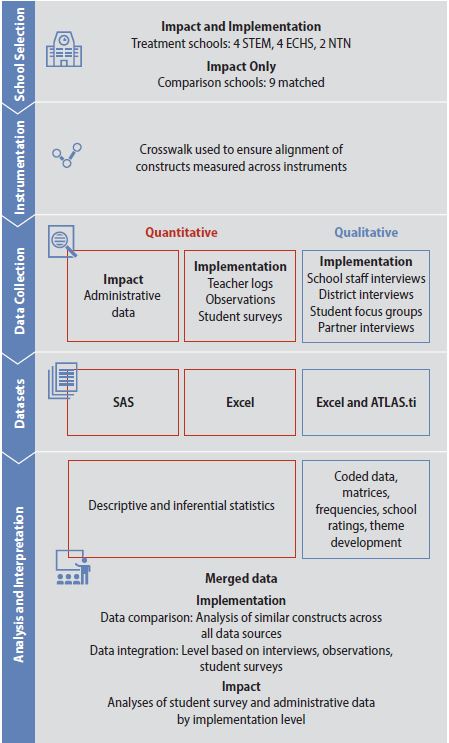
The qualitative and quantitative strands of the study were integrated at multiple points from the design phase to the analysis and interpretation phase. Figure 1 presents a diagram of the procedures. During the design phase, the team developed research questions to take advantage of the information each strand could uniquely provide, but we also relied upon multiple different qualitative and quantitative data sources whenever possible to capture similar constructs across measures.
The research question addressed in the current paper—What are the key characteristics of classroom instruction in the STEM schools (i.e., content, mode of instruction, pedagogical focus, student-teacher interaction)?—was measured using both qualitative sources (staff interviews and student focus groups) and quantitative sources (classroom observations, teacher instruction logs, and student surveys). During the sampling process, the qualitative and quantitative strands were integrated by selecting either the same or the same types of participants for multiple measures. Strategies for integrating qualitative and quantitative data during the instrumentation phase and during the analysis and interpretation phase are presented later in this paper. Overall, aligning the qualitative and quantitative strands from the outset of the study greatly facilitated efficiencies across all phases of the study.

Data Collection
The TSL study collected a wealth of data from several different sources. This paper focuses specifically on school staff interviews to illustrate the procedures used for one qualitative data source in an in-depth way, across as many stages of the study as possible. Links between school staff interviews and other data sources are provided throughout this paper to illustrate the multiple points of intersection across the qualitative and quantitative data sources. All study procedures complied with ethical standards for human subjects protections.
Sample Selection. The research team used purposive sampling to select schools varying in length of time operating, school model employed, and geographic location/region. A total of 49 staff interviews were completed: 10 school principals (1 per school), 10 school support staff (1 per school), 21 STEM teachers (2–3 per school, roughly split between science and math teachers), and 8 district staff (for 2 of the 10 schools, no district staff were familiar with the program). We selected key informants who could provide a range of viewpoints on STEM education at the school. While the unit of analysis was at the school level, we often collected data from the same participants across multiple measures (both qualitative and quantitative).
Instrumentation. Study instruments measured related concepts across both the qualitative and quantitative strands. A comprehensive crosswalk displayed constructs and items from each instrument side by side, which greatly facilitated alignment across measures and analysis across study strands. A panel of experts in program evaluation and STEM education, including an NCNS program representative, facilitated instrument development. Staff interview instruments mixed open-ended items along with items designed to elicit a Yes/No response with accompanying “Please explain” open-ended follow-up questions. As described later in this paper, this type of questioning accelerated analysis because one could quickly understand the essence of a response by simply looking at the Yes/No portion of the items.
Staff interviews gathered information on key components of the program, evidence of program outcomes, and program implementation challenges and successes. Throughout the interview, participants were asked their opinions about the influence of the program on activities at their school, as well as the influence of the program on student outcomes. Some questions were posed to all staff, while other questions were asked of only those staff best suited to answer particular questions based on their role/position with the school (e.g., teachers were asked about classroom instruction, while principals were asked about schoolwide activities). Staff interviews lasted about one hour each.
Preparation of Interview Data. While the rapid-turnaround nature of this study did not allow for verbatim transcriptions, we aimed to produce high-quality notes by having someone familiar with the research goals (i.e., the lead interviewer or another team member familiar with the study) be present during the interview and summarize the audio recordings. Clear and consistent notation rules as well as training and periodic quality checks increased consistency within and between interview records (e.g., level of detail typed up, consistent documentation of skipped questions). Interview notes were prepared in such a way as to make them immediately available for analysis. This entailed typing up notes into a PDF form in order to then import the data directly into Microsoft Excel. One Excel file housed all interviews, organized by school. The file contained a column for each interview item and a row for each respondent. Data were then exported into ATLAS.ti (7.5) using its survey import feature, which is an efficient way to upload large numbers of interviews at one time. Importing data from Excel to ATLAS.ti allowed all responses to be coded automatically by question, another strategy that accelerated analysis. The 49 staff interviews yielded approximately 795 pages of data.
Analysis Strategies and Results
Overall Analytic Approach
Analysis was performed both within and across cases based on the analytic techniques and strategies outlined by Miles et al. (2014) and Saldaña (2013). In general, the approach consisted of the following steps:
-
Assigning codes using deductive and inductive reasoning, informed by coding types and steps outlined in Saldaña (2013).
-
Developing a series of matrices from which to generate inferences to identify patterns within and across matrices.
-
Integrating interview data with quantitative sources for both the implementation and the impact evaluation.
Using an iterative process of coding, pattern finding, theme development, and interpretation, the research team sought to reflect both the program theory (from a deductive perspective) and the participants’ views and opinions (from an inductive perspective) about what was important and which factors were influential in the changes participants perceived at their school. The resulting qualitative interview responses, once transformed and quantitized, facilitated the creation of program implementation ratings that could then be further analyzed in combination with the quantitative classroom observations and student surveys to inform the impact analysis (Miles et al., 2014; Sandelowski et al., 2009).
Assigning Codes. Staff interviews were coded in multiple phases. First, the qualitative team focused on coding key interview items, and then they grouped the items according to different themes/areas (e.g., brought together all items that asked about program influence). Coding consisted of a three-step process at this stage to reduce responses to a level that was easier to quickly comprehend when reviewing large amounts of data across several interviews and schools. Using an eclectic coding approach, as outlined in Saldaña (2013), multiple different types of codes were applied simultaneously, which maximized the amount of information coded during one pass.
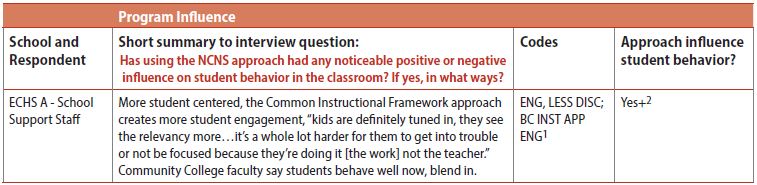
Figure 2 shows an example based on one participant’s response to a question that measured staff perceptions of the program’s influence on student behavior: “Has using the NCNS approach had any noticeable positive or negative influence on student behavior in the classroom? If yes, in what ways?” (This item is abbreviated as “Influence student behavior” throughout the rest of this paper.) Using Excel, coders first summarized the full, raw data responses into a short summary statement and then applied codes to capture the essence of each response. The code and summary statement appeared side by side along with the more highly generalized Yes/No/Mixed/Don’t know response. In addition, coders captured whether the response reflected a positive or negative direction (i.e., it was possible that a change in student behavior could have been for the better or worse). “Mixed” responses included respondents who said “Yes and no” or a qualified Yes, such as “Yes, but,” “Somewhat,” or “A little.” With this process, any particular interview question could have up to four columns in the Excel file: (1) the full raw data response (not shown in Figure 2), (2) short summary, (3) codes, and (4) Yes/No response.

Seeing the data this way allowed coders and other team members to quickly grasp the gist of the interview response while keeping the entire full response in view for clarification and/or additional context as needed. Coders had the flexibility to use either Excel or ATLAS.ti to review the full responses. Because the Excel file only contained responses to select key questions, coders reviewed responses to all other interview items in ATLAS.ti to identify any additional relevant responses to code. These responses were then added to the full raw data response column in the Excel file using brackets and were incorporated into the coder’s short summary, coding, and Yes/No response. This process brought together relevant responses from throughout the interview under the appropriate question, in one column in the Excel file.
The coders had previous experience conducting qualitative interviews but very little experience coding or analyzing qualitative data. A lead coder with experience in qualitative methods trained the coders. Coders were either the team member who led the site visit for a particular school or another team member who was present as a note taker for the majority of interviews at the school. This continuity between data collector and coder facilitated coding because it took advantage of the in-depth knowledge interviewers gained during data collection and enhanced the team’s understanding of the individual schools overall. Coders completed coding one school before proceeding to the next to facilitate understanding the school as a whole. Coding assignments were divided evenly across the three-person coding team.
Coders were given general coding guidelines up front, as well as some standardized codes developed from a deductive perspective to apply for some questions (e.g., types of professional development a respondent may have participated in through the program), but otherwise coders used very few predetermined labels at this point in the process. This allowed many codes to be created from the bottom up, based not only on responses from a variety of staff across multiple schools but also from the perspective of multiple coders with diverse viewpoints. This process facilitated the incorporation of insights that coders gained from analyzing their own set of schools (Richards, 2015), which is important for fully understanding a case.
After initial coding was completed for a few cases and preliminary codes were developed, standardized labels were created based on the preliminary codes and then coders applied those labels to all interviews. All codes created by individual coders were incorporated into the coding list by either renaming them to capture broader topics discussed across sites or by adding them to the code list “as is” for use by other coders. New codes were added to the code list on an ongoing basis during coding and were shared immediately among coders. The code list included the code name (abbreviated to serve as a quick reference during coding) as well as the definition of the code and examples of what to code and what not to code. The lead coder performed quality checks of 10 percent or more of interviews per coder throughout coding. Coders became skilled at the coding process very quickly.
Once this first phase of coding was completed for all schools, the lead coder reviewed all entries in the Excel file to ensure consistency. Data from the Excel file were then imported into ATLAS.ti for further subcoding during a second coding phase, which facilitated description of concepts in a more fine-grained way (Saldaña, 2013). The lead coder also used ATLAS.ti to explore relationships between codes (using the co-occurrence functions and network views) as well as to calculate coding frequencies (through coding reports). All of these data were then used to create the matrices discussed in the next section.
Developing a Series of Matrices from Which to Generate Inferences
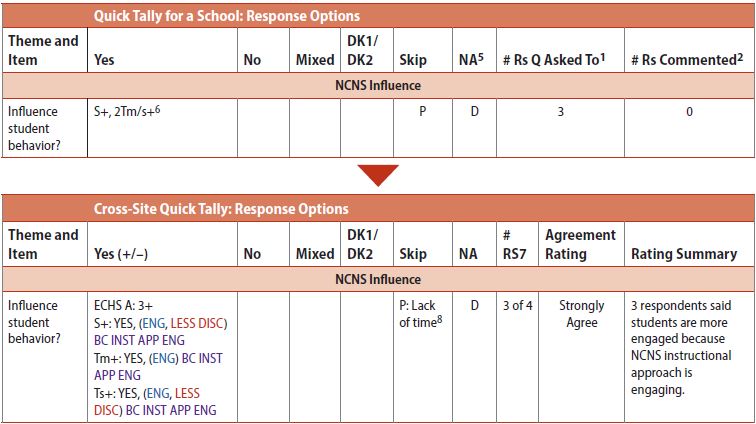
Initial Matrices and Agreement Ratings. Once coders completed the Excel file for a school, they filled out what the team called a Quick Tally matrix for that school (see the top portion of Figure 3 for an example based on the “Influence student behavior” item). This reduced the Excel file data overall and facilitated cross-site comparisons later in the analysis. The Quick Tally matrix is most similar to Miles et al.'s (2014) conceptually clustered matrix, which displays rows and columns to “bring together major roles, research subtopics, variables, concepts, and/or themes together for at-a-glance summative documentation and analysis” (p. 173). For each question, coders entered only the key pieces of information needed to form an overall picture of the school: Yes/No answers by respondent role, whether the question was skipped for some reason or not applicable (i.e., not part of the interview protocol for the particular respondent), and a count of any respondents who made a relevant comment spontaneously without being asked.
Figure 3 shows that three respondents—the school support staff (S+) and two teachers (2Tm/s+)—said the program influenced student behavior in a positive way. The item was skipped during the principal interview (noted in the Excel file as due to a lack of time). The item was not part of the district staff interview protocol, and the district staff respondent did not spontaneously offer a comment relevant to the question. A completed Quick Tally matrix displayed the information in the top portion of Figure 3 for each interview item in separate rows down the table, for one school. Because not all interview items were formulated as Yes/No questions, item descriptions in the Quick Tally were revised to form Yes/No questions for comparative purposes. For instance, a response to an interview question asking about the different ways an activity was implemented in class would be counted as “Yes” if the respondent mentioned any ways that the activity took place at all in class.

The Quick Tally made a great deal of useful information available in one table. It provided a snapshot of how each participant within the school responded to the questions (useful for identifying patterns among respondents, such as participants who answered negatively across several items). It allowed for comparisons of different roles/groups (useful for seeing whether teachers differed from principals, for example, or whether math teachers differed from science teachers). It also allowed for pattern recognition and conclusion drawing across items/interview areas (e.g., while only one item is shown in Figure 3, respondents from this school responded primarily in a positive way about the program across all items).
The next steps were to populate the Quick Tally with more detailed information beyond a simple Yes/No response in order to analyze the data more fully and to expand the Quick Tally by bringing together information from all schools into one document to facilitate comparison making across schools. To that end, a Cross-Site Quick Tally was created that included the Yes/No responses by school as well as codes applied to each question (see the bottom portion of Figure 3). Color coding was used to distinguish codes quickly from one another. The Cross-Site Quick Tally also included an agreement rating summarizing the overall strength of the positive/negative responses for each school.
Agreement ratings were based on several factors, some of which were weighted more heavily than others (a concept called “weighting the evidence” is outlined in Miles et al. 2014, p. 300). In general, agreement ratings were based on (1) counts of responses within a school, (2) the quality of the response, and (3) whether the respondent was a key informant. For example, a rating of Strongly Agree was applied for the item “Influence student behavior” for the school shown in Figure 3 because the majority of respondents (3 out of 4) answered in the affirmative, all three elaborated on their response, and two were key informants most knowledgeable about the particular topic (i.e., teachers speaking about the classroom). Ratings also factored in any challenges respondents faced as they implemented the program (e.g., a school may have received a lower rating if multiple respondents indicated challenges not yet overcome). In general, agreement ratings were another way of quickly summarizing the data across participants by school. Subsequent analyses relied upon agreement ratings as one measure of program implementation at the school.
Overall, it took analysts an average of 2.2 hours to complete the Excel file and Quick Tally for each interview (range of 0.5–4.0 hours). It took another hour per interview for the lead coder to apply standardized, in-depth labels and complete the cross-site matrix. At the end of this stage, the school staff interview data were transformed into codes and numbers, which provided a way to examine the schools at an aggregate level immediately after coding was completed. At the same time, data needed for thick, rich descriptions remained available in Excel and ATLAS.ti for subsequent analysis and inclusion in reports. While coders had access to the raw interview data coded by question in ATLAS.ti, Microsoft Excel was the primary software used for coding for several reasons:
-
Excel was more accessible and familiar to coders and the rest of the research team.
-
Having all data for all schools in a single Excel file facilitated ongoing quality checks (e.g., columns could be sized to allow an analyst to scan all responses quickly and apply standardized codes).
-
Simple tabulations, such as counts of Yes/No responses, could be calculated quickly within and across schools using Excel.
Importing the Excel data into ATLAS.ti for further analysis simplified the exploration of relationships between codes and calculation of counts of codes across items. Overall, the benefit of using both Excel and ATLAS.ti, as well as the Cross-Site Quick Tally matrix, for coding and analysis was the ability to toggle between the three sources and choose the one that supported the quickest and most feasible way to accomplish the task at hand.
Beyond Initial Matrices. After data were coded and initial matrices were completed, three types of second-stage matrices could then be created relatively quickly: a Participant Responses matrix, an Agreement Ratings matrix, and Content matrices. Consolidating an incredible amount of information in just one or two pages each, these matrices aided further data analysis by presenting:
-
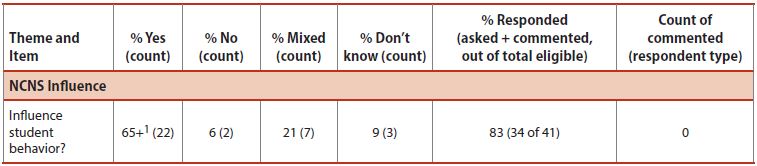
Aggregate responses across respondents and schools in the Participant Responses matrix (Figure 4), which allowed the team to examine overall trends in the data
-
Agreement ratings across items and schools in the Agreement Ratings matrix (Figure 5), which allowed the team to examine patterns and begin to explore the level of program implementation across the schools
-
In-depth information on the substance of the responses to each item in the Content matrices (Figure 6), which allowed the team to see patterns within and across items at the school level and across schools.
These second-stage matrices presented information across schools in a way that facilitated sharing findings from both the qualitative and quantitative strands of the study. Data were displayed in a format familiar to all team members (i.e., Microsoft Word tables). Information was presented in a way that permitted team members to easily grasp the basic findings of the interview data and begin to think about how those findings might relate to other data sources, including quantitative data, for the purposes of integration of findings.
Participant Responses Matrix. Figure 4 is an excerpt of a matrix displaying aggregate participant responses across schools. The full version of the matrix displayed the complete list of interview items in rows down the table, for a one-page overview. Presenting data irrespective of school gave the team a first look at overall trends across participants and schools. From this matrix, the team learned that the majority of responses were in the affirmative for most interview items. The team also learned that items with a lower level of agreement reflected a Mixed response more often than an absolute No response. Having a snapshot of overall trends also opened up possibilities for new directions to explore with further analysis. We noticed, for example, that more respondents answered Mixed to the “Influence student behavior” item than to some of the other items. This prompted us to look back at the coded data to find out why this might be the case.

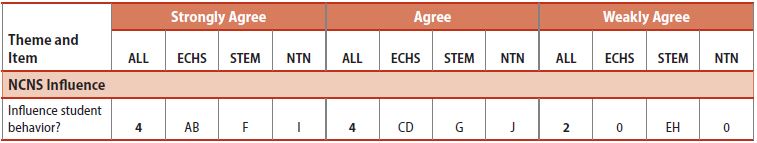
Agreement Ratings Matrix. After reviewing the aggregate participant responses, we looked at the level of agreement within each school and across schools, through what the team called an Agreement Ratings matrix (Figure 5). Providing an overview of agreement ratings for each item, this matrix facilitated analysis of overall trends by school (e.g., schools A and B = “AB” as shown in Figure 6), as well as comparisons across school model types (i.e., ECHS, NTN, and STEM as shown in Figure 6). Aggregate counts within each cell could easily be summed for more generalized data.
From the Agreement Ratings matrix, the team learned that the agreement ratings for most items were at the Agree level across schools (not strong, not weak). We also began to see that no one school model type overall seemed to fare better than the other school model types, but some individual schools did seem to fare worse than others overall. The Agreement Ratings matrix also helped simplify subsequent summary analyses. For example, we were able to easily see from the table that items related to “NCNS Influence” were rated Strongly Agree more frequently than in other areas of the interview, indicating variation in the data that could be explored further.

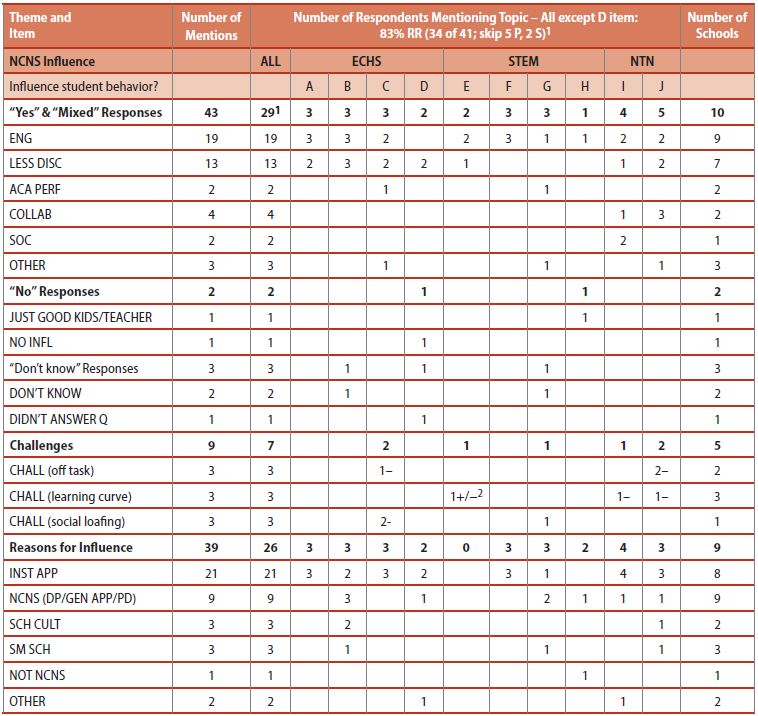
Content Matrices. While the Participant Responses and Agreement Ratings matrices provided useful information about the overall level of affirmation/agreement for interview items, we needed more detail to describe the substance of the responses, in a more concise format than the Cross-Site Quick Tally. To that end, we created a Content matrix for each item to display the codes applied to each response for each school. Figure 6 shows an example from the “Influence student behavior” item. The Content matrices brought a great deal of information into just one table: a list of topics mentioned within each of the Yes/Mixed/No/Don’t know responses; details on challenges faced, including positive (+) and negative (−) marks to indicate whether the challenges had been overcome; and the reasons respondents cited for influence or changes they perceived at their school (whether that was the program or something else).
The matrices also provided corresponding frequencies for each topic according to school and school type, as well as totals summed across schools. Footnotes and bulleted lists were added below the matrix to provide context, descriptions of patterns, and other summary information (not shown in Figure 6). The matrix displayed other relevant counts, such as the number of respondents who answered the question (e.g., all respondents except the district staff, as shown in Figure 6) and the response rate from the Participant Responses matrix (“RR” as shown in the Figure 6 header). Content matrices displayed all of these details in a single matrix, providing at-a-glance information needed to facilitate understanding and interpretation of complex data across schools.
.jpg)
From the Content matrix, Figure 6, we saw that improved engagement (ENG) and fewer disciplinary problems (LESS DISC) were the most frequently cited student behavior changes attributed to the NCNS approach. Improved academic performance (ACA PERF), increased student collaboration (COLLAB), and an increased sense of community among students (SOC) were also mentioned. Respondents who said student behavior did not change as a result of the NCNS approach attributed positive student behavior to “Just good kids/teacher” or simply said there was no NCNS influence. As mentioned previously, respondents faced challenges with students being off task and/or letting other group members to the work (social loafing), as well as with new students becoming familiar with the demands of the student-driven instructional approach used at the school (learning curve). Respondents most frequently attributed improved student behavior to either the NCNS instructional approach (INST APP) or other factors related to the NCNS program, such as the Design Principles (DP), the approach in general (NCNS GEN APP), NCNS professional development (PD), school culture (SCH CULT) or being a small school (SM SCH).
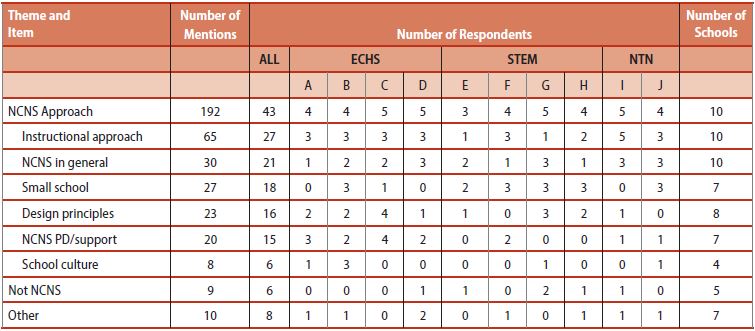
Once the Content matrices were created for each item, we looked for patterns across the Content matrices and created the between-item matrix shown in Figure 7. We found the two most frequently cited reasons for influence across items were the program’s instructional approach (INST APP) and the Design Principles (DP). One or both of these factors were mentioned by at least one respondent from each school and often by several respondents.
.jpg)
We then looked back at the coded data and found that, when respondents cited the Design Principles, they often mentioned one specific Design Principle, Personalization. Personalization refers to students knowing they can count on adults at the school to support them academically, emotionally, and personally. Also, an engaging instructional approach falls under another Design Principle called Powerful Teaching and Learning. Thus, the two key program elements from the NCNS Design Principles that participants most often mentioned as responsible for change in the school environment and for student outcomes were (1) Personalization and (2) Powerful Teaching and Learning. Regardless of school model type (ECHS, STEM, NTN), interview respondents attributed many positive student outcomes to either or both of these program elements: improvements in student behavior, teacher-student relationships, student engagement, academic achievement, and dropout patterns, as well as student pride and excitement about school. These two program elements were also often mentioned as successes of implementing the NCNS approach. Once we identified these two key program elements, we were able to focus subsequent analyses on these two factors, as described in the next section. Furthermore, because the matrices displayed information across school types, we were able to see similarities that we may not have seen had we only examined the data within school types. This helped us understand that school type was not a driving force behind school differences we observed in the matrices.
Integrating Interview Data with Quantitative Data Sources
Focusing on Key Implementation Factors. Having identified the two key program elements that respondents felt were most important for implementation (i.e., Personalization and Powerful Teaching and Learning), we were able to focus analysis of the quantitative implementation data sources (e.g., classroom observations and student surveys) on items that measured these same two concepts for the implementation evaluation. Student survey data analysis could then focus on the use of engaging instructional techniques used in the classroom (e.g., working with a group to design a solution to a problem), as could analysis of classroom observations (i.e., students working collaboratively in teams or groups).
Creating an Overall Implementation Score for Each School. Transforming the qualitative interview data into quantitative agreement ratings provided the opportunity to place these ratings into a formula alongside other quantitative data for the purposes of judging the overall implementation level of each school, particularly with respect to the two key program elements identified by the qualitative interviews (Personalization and Powerful Teaching and Learning). For example, a school would receive a high implementation score if it (1) was rated as Strongly Agree on items measuring Personalization and Powerful Teaching and Learning from the staff interviews, (2) received a high rating on similar items from the classroom observations, and (3) was reported by most students as using engaging instructional techniques in the classrooms and having a respectful school culture. The quantitative data for the impact evaluation (e.g., student performance, course-taking, engagement) could then be analyzed by school according to the different implementation levels.
Discussion
This paper details the procedures our team used for collecting and analyzing qualitative data in a high school STEM education program evaluation study. I presented our procedures for integrating the qualitative and quantitative strands of the study from the design phase to the analysis and interpretation phase. Using selected items from the semistructured staff interview data, the paper illustrates specific ways of using Microsoft Excel, ATLAS.ti, and matrices outlined in Miles et al. (2014) to efficiently code and analyze qualitative data both within and across cases in what the research team believed to be an efficient, high-quality manner and to facilitate the integration of qualitative and quantitative data analysis. My intention is to provide a methodological approach that could be replicated by other researchers engaged in large-scale, rapid-turnaround, team-based mixed methods research.
Qualitative data collection produces thick, rich descriptions by design. Interviews alone can result in hundreds if not thousands of pages of information, and even more qualitative data are generated in a mixed methods study that relies upon multiple sources of qualitative data. All of this information can be overwhelming and must be reduced to a manageable form (Richards, 2015). Completing the Quick Tally, Cross-Site Quick Tally, Participant Responses matrix, Agreement Ratings matrix, and Content matrices helped our team simplify a substantial amount of data for multiple schools. Organizing data in a succinct, coherent way greatly facilitated pattern matching and inference building across cases. The matrices also provided a simple way of sharing the overall findings with other team members, with little elaboration or textual description required.
Over the past decade, qualitative data analysis (QDA) software packages have become a widely used, powerful way of managing, organizing, coding, and analyzing large volumes of qualitative data (Patton, 2015). Microsoft Excel is not commonly considered a QDA software package, but Niglas (2007) described several benefits of using Excel within the context of mixed methods studies, including its ready availability and familiarity.
While training an entire team in a QDA software package may be ideal (Richards, 2015), it is not always practical. Training can be expensive and time consuming, and not all team members will be interested in such training, nor are they likely to use the software regularly enough to maintain their knowledge and skills. Our study presented a solution to this by combining the use of Excel and Word, software familiar to most researchers, with ATLAS.ti to not only code data but also present it to other team members in such a way as to facilitate team-based analysis and interpretations.
While quantitizing the qualitative data sacrificed some of the rich description (Driscoll et al., 2007), our intention was not to replace the qualitative data but rather to maximize its potential by using it to explore relationships that could not have been explored through qualitative analysis alone (Fakis et al., 2013). Rich descriptions of cases and quantitized data are important for reporting purposes in their own right. Our goal was to balance the need to bring order to the data without trivializing the rich detail by reporting just numbers in the final write-ups for publication (Richards, 2015). Displaying the full raw-data response alongside a short summary and a more highly generalized count in Excel and ATLAS.ti was one way of ensuring that analysts had quick access to the relevant responses needed to flesh out numbers, not only for reporting purposes but also throughout analysis to test assertions and conclusions.
Through the analysis process, the qualitative analytic team identified two key program elements most critical to influencing student outcomes and changes at the school: Powerful Teaching and Learning (e.g., engaging classroom instruction) and Personalization (e.g., relationships between teachers and students). This discovery allowed the team to then focus subsequent analyses specifically on these key factors. Because the data collection instruments were aligned to measure similar constructs, future analyses can examine these two key factors across multiple other qualitative and quantitative data sources. We were also able to develop implementation scores that integrated items related to these factors from both the qualitative and quantitative sources, which could then be used to inform the impact evaluation. Focusing subsequent analyses and creating implementation scores are just two uses of the qualitative data in this study. Many other opportunities for integration exist because the study was designed at the outset to link the qualitative and quantitative data for multiple purposes.
Although coding, analysis, and interpretation took approximately 3 hours per interview, these research steps generally take a considerable amount of time for any qualitative data, particularly in a complex study (Driscoll et al., 2007). Miles et al. (2014) estimate that “you need roughly 3 to 5 times as much time for processing and ordering the data as the time you needed to collect it” (p. 73). While the approach illustrated in this paper fell on the lower end of this estimate, researchers considering using these methods should bear in mind that the speed of analysis may have been affected by the “quantitatively informed” (Sandelowski et al., 2009, p. 216) data collection approach used for the interviews. That is, the interview instrument relied in part on quantitative Yes/No items, and thus the time to complete coding may have been shorter for this study than for studies using a less quantitatively informed approach for collecting interview data. Nevertheless, the methods used in this study were intended to provide high-quality, consistently coded data across multiple coders in an efficient manner, which could then immediately be displayed in matrices to aid further analysis.
In conclusion, while analyzing qualitative data through matrices is nothing new, there are limited examples of its use in practice. This paper provides one example from a large-scale, multisite, team-based mixed methods evaluation study. Our research team would like to see other studies improve upon the methods discussed in this paper by bringing new insights to the process, incorporating different uses of QDA software capabilities not discussed here, and applying these methods to other data sets.
Acknowledgments
The author would like to thank the study’s qualitative analytic team: Elizabeth Glennie, Suyapa Silvia, Nina Arshavsky, Elizabeth Parish, and Lisa McCaskill. Funding provided by National Science Foundation grant 1135051 and RTI International internal research funds.