

Introduction
This paper describes patterns in gender differences in early grade reading and mathematics outcomes across a set of 19 international education studies funded by the United States Agency for International Development (USAID) and implemented by RTI International over the past decade. The paper will advance knowledge and address gaps in the published literature in the international education field via a multicountry analysis, tapping into data sets from nations across Africa, Asia, Latin America, and the Middle East. We aimed to respond to the dearth of globally sourced data by clarifying variations and patterns in gender differences in learning achievement across countries.
Background
In this section, we highlight patterns across the literature to illustrate what we currently know about gender differences in educational outcomes. We then identify gaps in the knowledge that we sought to fill through the analysis described in this paper.
Sustainable Development Goal 4 (SDG 4; see United Nations Statistics Division (UNSTATS), n.d.) compels the international community to invest in inclusive, high-quality education, emphasizing increased equity for traditionally marginalized groups of learners. This ambitious global agenda has galvanized collection and reporting of a wide range of data on education access, efficiency, and learning outcomes in countries across the globe, with disaggregation by gender and other markers of inequality. Targets and indicators for SDG 4 focus on access to and enrollment in high-quality schools along with measurable gains in literacy, numeracy, and vocational skills. Nevertheless, SDG 4 progress reports to date appear to overemphasize indicators associated with access to and completion of schooling (i.e., targets and indicators 4.1.1 through 4.3.1) or do not offer data on other indicators that capture learning at various ages of schooling. In our review of the literature, we moved beyond an either/or approach to address not only access and completion but also learning, consistent with the data collected in the World Inequality Database in Education (WIDE; see United Nations Educational, Scientific and Cultural Organization [UNESCO], (2022b), to examine how gains in education have been presented.
Over the past decade, gender gaps in education have declined in several low- and middle-income countries (Buhl-Wiggers et al., 2021; UNESCO, 2022b). Gains in gender parity on measures of access to education, such as enrollment in primary school and rates of out-of-school children, have been notable (UNESCO, 2022b; United Nations Children’s Fund (UNICEF), 2022). For example, the most recent Global Education Monitoring Report (United Nations Educational, Scientific and Cultural Organization (UNESCO), 2022a), an important source of multicountry information, indicated that, at the global level, there appears to be close to no gender gap in primary or secondary enrollment, attendance, or out-of-school rates between boys and girls. However, these metrics of access and enrollment at a global level gloss over the variations in gendered experiences of students and their educational achievement at local, national, and regional levels (Buhl-Wiggers et al., 2021; United Nations Educational, Scientific and Cultural Organization (UNESCO), 2022a). Disparities at the expense of girls continue to exist in countries in North and Sub-Saharan Africa at all levels of education. In contrast, disparities come at the expense of boys at the secondary level in Central, South, and East Asia. Latin America, Caribbean, Europe, and North America are the only regions with substantial reported data where there is little to no gender gap in educational participation (Local Burden of Disease Educational Attainment Collaborators, 2020; UNESCO, 2022a). Although a full analysis of the relevant literature is beyond the scope of this paper, it is important to note that differences in these patterns of literacy and mathematics achievement are contextually variable and explained by a range of factors, such as socioeconomic status, cultural norms around gender, and geographic location, to name a few (Buhl-Wiggers et al., 2021; Evans et al., 2020; Local Burden of Disease Educational Attainment Collaborators, 2020; United Nations Children’s Fund (UNICEF), 2022; United Nations Educational, Scientific and Cultural Organization (UNESCO), 2022b).
Indicator-linked data related to education access and completion provide some insights into gains in schooling participation, but they do not capture the actual skill levels or proficiencies of the population, and thus do not yield information on educational achievement. Moreover, indicator reporting often synthesizes data based on different underlying measures or is limited by the lack of availability of data in some contexts. Thus, these indicators are not structured to ensure the capture of information on comparable measures across countries and may inadvertently gloss over the complexities across sociopolitically distinct regions or countries.
Until recently, data on gender differences in early grade learning outcomes tended to be concentrated in wealthier countries, above third grade, or both. For instance, in their analysis of decades of reading data from the United States, Reilly and colleagues (2019) found that girls had higher reading scores than boys at every assessment time point and in every grade. Data from the Organisation for Economic Co-operation and Development’s Programme for International Student Assessment (PISA) for 15-year-olds and the Progress in International Reading Literacy Study (PIRLS) in approximately fourth grade—both typically conducted in upper-income countries—point to the persistent reading advantage that 10-year-old girls have (Lynn & Mikk, 2009).
This tendency to concentrate on wealthier countries is changing, with more and more data being collected from lower- and middle-income countries. The latest Global Education Monitoring Report synthesized data from different measures across a range of grades to describe learning achievement at a global level. According to the report’s analysis, “More girls than boys achieve minimum proficiency in reading and the gap increases with age” (UNESCO, 2022, p. 9). The report noted that, at the primary education level, only five countries reported data showing the gap in minimum reading proficiency disadvantaging girls. In 95 other countries, the gap in minimum reading proficiency came at the expense of boys at the end of primary and transitioning into lower secondary education.
The Global Education Monitoring Report analysis also illustrated that boys performed slightly better than girls in mathematics in the early grades (through grade 3) across several income groups in several countries, although this pattern was not universal. Later in school (after grade 4), the pattern reversed to favor girls in many countries but again did not hold universally. There also appeared to be higher variability in boys’ scores in mathematics compared with girls’ scores, and in general, when girls outperformed boys in mathematics and science, they also tended to outperform them in reading.
Given the variability in measures used to consolidate data, however, these findings need to be interpreted with caution. Moreover, country-level data varied in terms of income group (i.e., low, lower-middle, upper-middle, and high), and in some cases, data from different income groups within the country were used in making comparisons between early- and later-grade achievement. As such, the consolidated data could be influenced by other social factors that contribute to learning achievement, thereby impeding accurate understanding of the influence of gender on differential learning outcomes.
In summary, this literature review identified several shortcomings in the global literature on gender differences in learning outcomes. Those shortcomings included the lack of substantial reporting on lower- and middle-income countries or the early primary grades and the variability in the measures used to capture student learning, which made cross-country discussion challenging. We overcame these shortcomings by tapping into the growing body of data from USAID early grade learning projects, all of which used the same measurement tools and focused on either grade 2 or grade 3 in early primary school.
Methods
This section first describes the data sets we used in our analysis, including an explanation of where data were collected and the level of representativeness of the data samples. Next, the section delves into the measures of learning outcomes that we used in the analysis: data collected during administrations of the Early Grade Reading Assessment (EGRA) and the Early Grade Mathematics Assessment (EGMA).
Data Sets
Annex A lists the studies used for this paper in detail, breaking down each study by the language(s) of assessment. To conduct the analysis, we used the data from these 19 USAID-funded studies of early grade reading outcomes conducted between 2012 and 2021 across 21 different languages in 14 locations: Cambodia, Egypt, El Salvador, Ethiopia, Ghana, Jordan, Kenya, Kyrgyzstan, Liberia, Nepal, Philippines, Tanzania, Uganda, and the West Bank. All of the studies assessed students’ reading skills in grade 2 or grade 3. In some instances, students were assessed in more than one language, such as English and Kiswahili in Kenya. Only 7 of the 19 studies collected information on early grade students’ mathematics ability, however. Those mathematics assessments were conducted in Egypt, Ghana, Jordan, Kenya, Liberia, and Tanzania.
All datasets from these studies were already weighted to the population they were intended to represent (whether nationally, regionally, or linguistically). Annex A includes information about each study’s representativity.
The studies analyzed for this paper assessed 47,078 grade 2 students and 27,427 grade 3 students for reading, and 23,810 grade 2 students and 7,723 grade 3 students for mathematics. The sample was approximately 52 percent female, on average, in each study. Each study had collected a range of other demographic details on the students, but we were able to find only a small number of comparable variables to use in our analysis. For example, information on student socioeconomic status typically was collected, but it was defined in context-specific ways; therefore, we could not use it for cross-country comparisons. As such, we limited our analysis of background demographics—and, thus, our presentation in this paper—to two variables that were consistently collected and could be objectively compared across contexts: student grade and sex.
Spanning from Latin America to the Middle East, Africa, and Asia, the countries included in the analysis represent a range of locations and socioeconomic contexts. The Human Development Index (HDI; see United Nations Development Programme (UNDP), 2022) is a useful summary measure of each country’s achievement across multiple domains of human development, including health, education, and standard of living. As shown in Table 1, the EGRAs covered four countries in the low HDI category, seven in the medium category, and two in the high category in 2021 (UNDP, 2022). For more information about the studies we used, please see Annex A. The EGMAs were implemented in two countries with high human development, two with medium human development, and two with low human development (all six are indicated in italics in the table). As such, these data sets presented an opportunity to describe gender differences in reading and mathematics outcomes in a diverse set of countries, with potential relevance across global contexts.
Measures
The studies we analyzed for this paper used validated assessment tools that have been widely deployed in the field of international education (Platas et al., 2014; RTI International, 2016a). The EGRA is a collection of subtasks administered in a one-to-one format that measures students’ progress toward learning to read, most commonly in grade 2 (Gove & Wetterberg, 2011). Initially conceived in 2006, the EGRA has always been open source, with toolkits on adaptation (RTI International, 2016a, 2016b), and has been used in dozens of countries and languages. Many of the subtasks in the EGRA align with skills identified in the Global Proficiency Framework for Reading: Grades 1 to 9 (UNESCO Institute of Statistics et al., 2020b). Moreover, many users have posted their results to an online barometer (earlygradereadingbarometer.org). The EGRA has been used for multiple purposes, including as a snapshot of abilities at a single time point to inform programming, for system-level monitoring, or as an evaluation of an intervention (Dubeck & Gove, 2015). Despite its use for these diverse purposes and contexts, however, the common format of the subtasks has given the international education community a shared language to describe reading abilities.
The theoretical framework underpinning the EGRA addressed the need to measure young students’ facility with print and contributing skills, typically in the lower grades of primary school. For a given EGRA administration, subtasks are chosen to match the purpose and the population of interest. For example, some of the subtasks measure the earliest of literacy skills that do not require print knowledge, whereas the most-complex subtasks measure skills that would be expected to develop after several years of formal reading instruction. The subtasks available when developing EGRA include (1) orientation to print; (2) letter sound identification; (3) initial sound identification; (4) segmentation (phoneme or syllables); (5) syllable identification; (6) familiar word reading; (7) non-word reading; (8) oral reading fluency (ORF); (9) reading comprehension; (10) cloze procedure, where children fill in missing words in passages; (11) listening comprehension; (12) vocabulary; (13) dictation; and (14) spelling (Dubeck & Gove, 2015). The intent of the selected subtasks is to gather the most information feasible in the least amount of administration time.
The language of assessment and grade-level expectations inform the development or adaptation of the subtasks. Using a corpus of grade-level text, EGRA designers calculate letter and word frequencies to use as a resource for item development. This step helps ensure that the selected words and the sentence structure (i.e., syntax) are valid for assessing literacy skills at the target grade level.
For our study, we focused on the EGRA subtask oral passage reading, as measured in correct words per minute (cwpm), also referred to as the ORF rate. Oral passage reading and its related subtask of comprehension represent the culmination of other, foundational skills that students will have been developing since the onset of formal reading instruction as they progress toward independent reading. Each student reads the passage aloud to an assessor (one-on-one), who scores for accuracy and rate. By measuring accuracy, we learn the extent to which students can apply their knowledge of the sounds of the language and the symbols (e.g., letters) that represent them. If students have low accuracy when reading the words attempted, it indicates that they need more phonics instruction so they can accurately decode words. Calculating the rate allows EGRA study teams to estimate how automatic the phonics knowledge is and avoids the ceiling effects (when too many students achieve the maximum score on the assessment) that could occur if the subtask were to be scored only for accuracy. Including the ORF rate also helps distinguish different ability levels while using the same passage, because students will recognize words (i.e., read) faster as their skills advance.
The passages used in the EGRA studies that we included in our analysis varied by language and location, but they did share commonalities. For instance, they all had a narrative text structure with a beginning, middle, and end and a problem to be solved. All the stories would have been unknown to the students but would have covered familiar topics (e.g., experiences at school, in the family, or in the community). The words and sentence structure would have been informed by the word corpus described earlier. The nouns would have been familiar (e.g., the name of one character), and the number of proper nouns would have been kept to a minimum (e.g., no names of places would be used). The exact number of words would have varied by language but designed with the parameter that a student should be able to read most of the passage within one minute by the end of grade 2. Often, the length is approximately 60 words.
The EGMA is a series of subtasks that, together, produce a snapshot of children’s knowledge of foundational mathematics skills (Platas et al., 2014). The emphasis across all subtasks is the number and operations domains, which are at the heart of early mathematical knowledge. Like the EGRA, the EGMA is administered in a one-on-one setting where the assessor orally provides all instructions to the student, thereby reducing any possible conflation with reading skills. It is open source and has been used in more than 15 countries.
The EGMA was developed by RTI in 2008, underpinned by robust evidence around how children acquire core mathematics skills from birth through the early primary years. All subtasks on the EGMA align with skills that have been identified in the Global Proficiency Framework for Mathematics: Grades 1 to 9 (UNESCO Institute of Statistics et al., 2020a).
The EGMA was designed for several purposes (Platas et al., 2016). First, the EGMA has been used as a diagnostic tool to inform educational policies and curricular reform. It illustrates children’s developing mathematical knowledge. Governments can then use EGMA’s data to develop new policies to increase achievement in mathematics and for textbook and curriculum reforms to focus on the skills that need the most support. Second, the EGMA has been deployed to measure the effect of interventions aiming to improve the quality of instruction. Using the EGMA as a pre- and post-intervention test, program implementers can show growth or lack of growth and identify areas for attention.
The subtasks on the core EGMA include (1) number identification, measuring students’ ability to fluently identify numbers from zero to 1,000 out of order; (2) quantitative comparison, measuring students’ knowledge of magnitude through the comparison of two different numbers; (3) missing number, measuring students’ ability to identify patterns in numbers; (4) addition and subtraction level 1, measuring students’ ability to fluently solve the basic math problems; (5) addition and subtraction level 2, measuring students’ ability to solve more-complex operations problems, with numbers up to 100; and (6) word problems, measuring students’ ability to solve oral word problems. Scores on EGMA subtasks are typically reported individually rather than aggregated into composites (Ketterlin-Geller et al., 2018). With that in mind, for the analysis presented in this paper, it was most straightforward to select one of the subtasks as the area of focus. We chose the quantitative comparison subtask because it represents one of the most fundamental number concepts: magnitude.
Quantitative comparison is an untimed subtask in which children are presented with two numbers and are asked to say the number that is greater. The subtask progresses from items with one-digit numbers (e.g., 5 and 7), to two-digit numbers (e.g., 58 and 49), and finally to three-digit numbers (e.g., 623 and 632). Inherent in understanding magnitude is understanding place value, which is another key concept in the early years. Research has shown that the ability to accurately compare quantities of numbers is predictive of later mathematics achievement (De Smedt et al., 2009). Other research using brain imaging has pointed to the activation of the part of the brain responsible for processing magnitude when subjects are solving the types of tasks in the quantitative comparison subtask (Dehaene et al., 2003). This subtask was consistently used across country contexts, and typically, it has enough variation in difficulty level both to capture skills progression across grades 2 and 3 and to avoid extensive floor or ceiling effects in either grade.
Findings
This section of the paper discusses patterns in gender differences in early grade reading and mathematics achievement. In this analysis, we chose to focus on the substantive differences by gender rather than the statistical significance of those differences. In line with the review of recent literature in the introduction section, reading outcomes were nearly universally stronger for girls than for boys across countries, a picture that was reversed for mathematics outcomes.
Overall Average Gender Differences
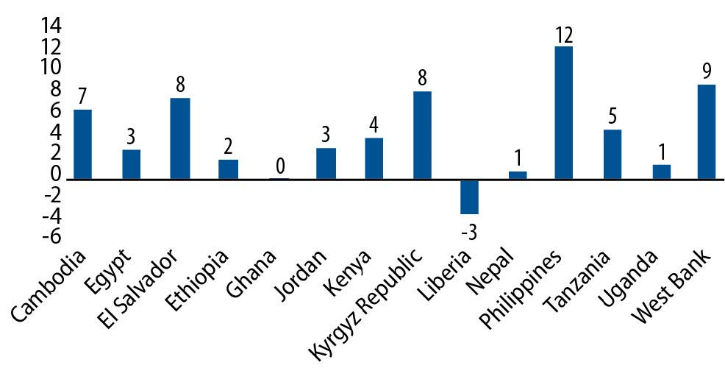
To investigate overall patterns in the differences in learning outcomes by gender, we first subtracted the average ORF scores (expressed as a raw score of words read correctly per minute) for boys from the average scores for girls, by location. Liberia was the only location where boys outperformed girls (Figure 1). Differences in ORF scores between girls and boys were substantial—7 cwpm or greater—in Cambodia, El Salvador, the Kyrgyz Republic, the Philippines, and the West Bank. Differences were lower in five other countries and approached zero in Ghana, Nepal, and Uganda.

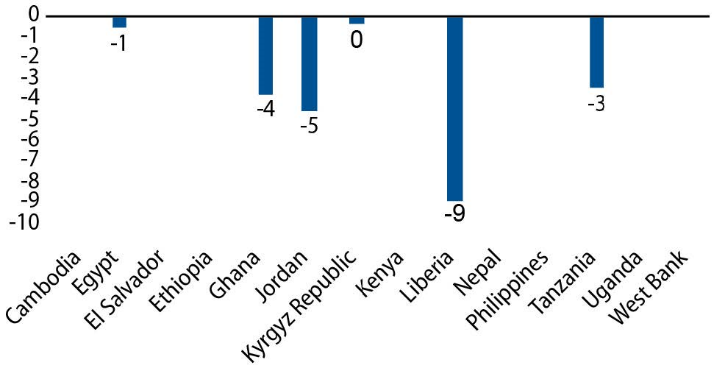
We then carried out the same analysis for average quantitative comparison raw scores (Figure 2). Although mathematics data were not available for all the same countries, this figure presents a near mirror image of Figure 1 above, with boys outperforming girls in all cases. For example, on average, girls scored 5 points lower than boys in Jordan and 3 points lower in Tanzania. The difference between boys and girls was negligible in Egypt and Kenya.

Gender Differences in Annual Increases
To emphasize the magnitude of the differences in reading ability between boys and girls that are established early and persist across primary grades, we also report gender differences as a percentage of the annual increase in ORF scores between grade 2 and grade 3 for 11 of the datasets. Note that this analysis could only be carried out for countries with data from grades 2 and 3 and large enough sample sizes. For example, the Philippines was not included because of the small sample sizes in the studies in that country. In addition, this analysis could not be replicated for mathematics because of the lack of mathematics performance data collected for both grade 2 and grade 3. The right column in Table 2 shows the results of this analysis. Positive values mean that, on average, girls scored higher than boys, which was the case in nine datasets. The negative values show the two countries where, on average, the boys scored higher. For six of the nine datasets where girls outperformed boys, they had 25 to nearly 50 percent of an annual gain over boys. In practical terms, this means those girls are between a quarter of a grade level to half of a grade level above the boys in reading.
Distributions of Gender Differences
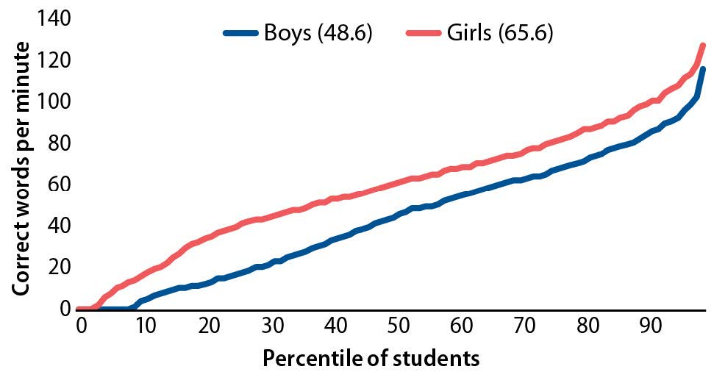
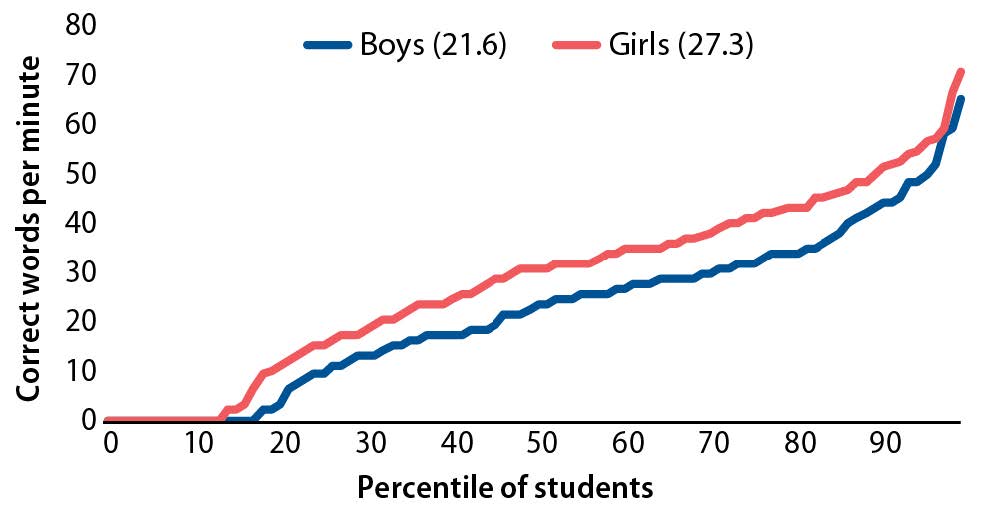
In addition to reviewing average score differences and differences in yearly increases between girls and boys, we analyzed the differences in cumulative score distributions by gender. These distributions allowed us to combine several bits of information into one figure, including the percentage of boys and girls scoring zero, the pace at which average scores rose above zero for both genders, and whether any gaps between boys and girls stayed constant or evolved as skills increased. The countries shown in the figures—Kenya, Jordan, the Philippines, and Tanzania—were chosen to illustrate these patterns because these datasets had relatively large sample sizes, which afforded more confidence in the accuracy of the reading fluency distributions. The assessments captured in these data sets presented a variety of geographies, grades, and languages. Other data sets analyzed for this paper displayed similar features but are not shown here for the sake of brevity.
Reading
Figures 3 through 6 plot the percentiles of boys and girls (x-axis) scoring in different ranges of correct words per minute (y-axis) in four different countries. Girls tended to leave the “floor” (or zero score) of the assessments earlier than boys, as can be seen in the bottom left corner of each figure. In other words, the percentage of girls who had an ORF score of zero was smaller than that of boys. These findings indicate that girls tended to pick up initial reading skills sooner than boys.
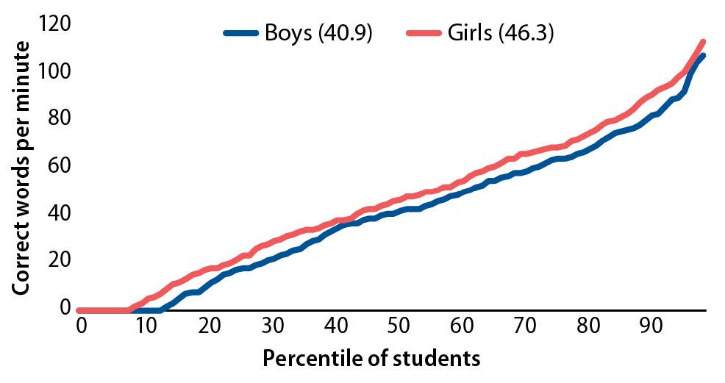
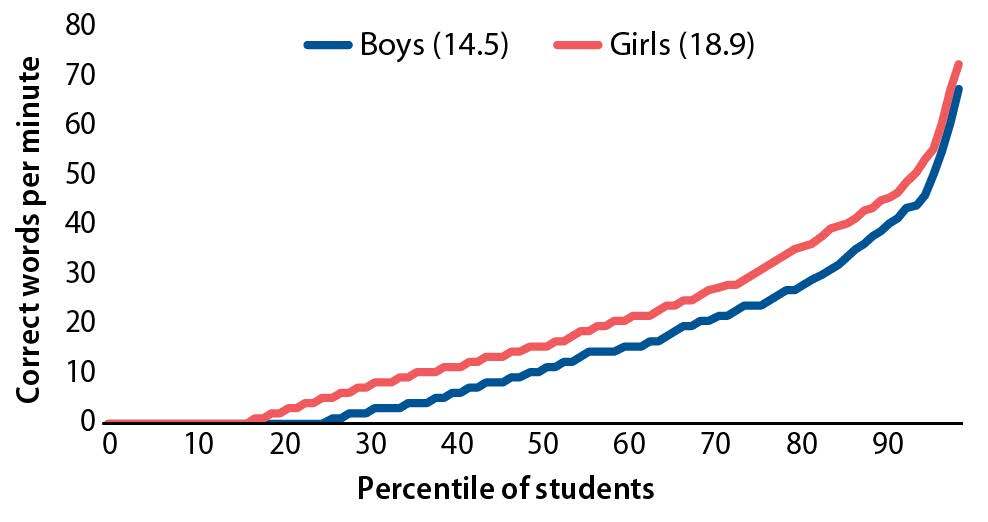


The graphs also show that once boys started developing reading skills, they tended to follow a trajectory like that of girls, with the blue and red lines parallel in all cases. Average ORF scores for girls were always higher in these results than for boys, however, and the gaps between the two groups tended to stay constant as skill levels increased. Another interesting phenomenon is that, in all four cases, the score trajectories for both sexes became steeper when reaching the top percentiles. This finding indicates that among the strongest readers in the given populations, the gap between boys and girls narrowed.
The first cumulative distribution in Figure 3 displays English ORF scores for grade 2 boys and girls from a 2016 assessment in Kenya. The figure shows that, of the girls assessed, only 8 percent scored zero; 13 percent of boys scored zero. Of the students who were able to read, the girls read approximately five words per minute faster than boys, on average (46.3 cwpm vs. 40.9 cwpm, respectively). The ORF trajectory for both girls and boys scoring above zero is similar, with a near-constant gap between girls and boys as reading fluency increases until the very top of the distribution, where the gap closes.
A similar pattern emerged in the data from Jordan, where students were assessed in Arabic in 2019. Figure 4 shows that of the girls assessed, only 17.2 percent scored zero, whereas 26.3 percent of the boys scored zero. The trajectory of nonzero ORF scores for girls and boys again runs almost parallel, with average scores of 18.9 cwpm for girls and 14.5 for boys, a difference of 4.4 words. As in the Kenya example above, the gap between genders started to close after the 90th percentile.
The data from the Philippines present similar patterns (Figure 5), although, in contrast to the other location examples, very few girls (2 percent) scored zero. In addition, there was a larger gap of 17 cwpm between the average scores of girls and boys (65.6 and 48.6 cwpm, respectively). Once again, we can also observe a faster onset of oral reading skills for girls than for boys. Girls’ scores continued to increase more rapidly than those of boys up until the 30th percentile, after which the gap remained roughly parallel. This finding echoes the patterns in Kenya and Jordan; in all three cases, girls read at a faster pace in the beginning, suggesting that they develop initial reading skills faster, but the boys then begin to follow a similar trajectory.
The data from Tanzania followed a similar pattern (Figure 6), where 14 percent of girls and 17.8 percent of boys scored zero before they started to follow parallel trajectories, averaging a difference of about 5.7 cwpm.
Mathematics
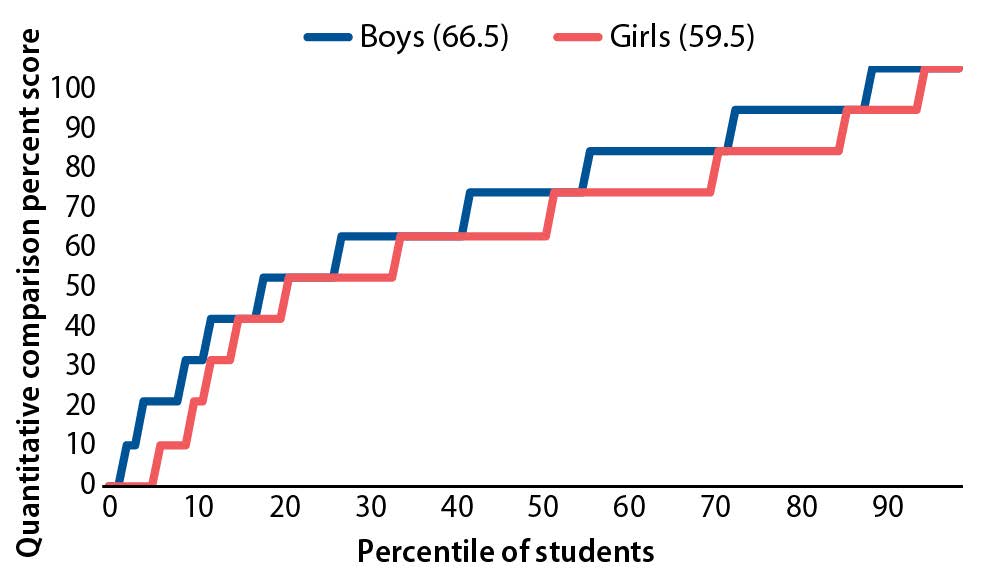
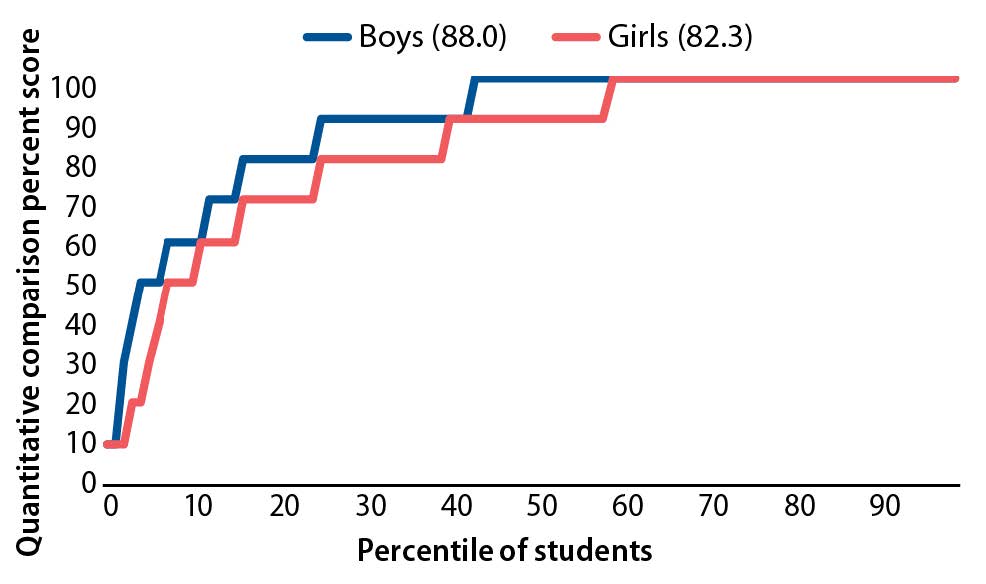
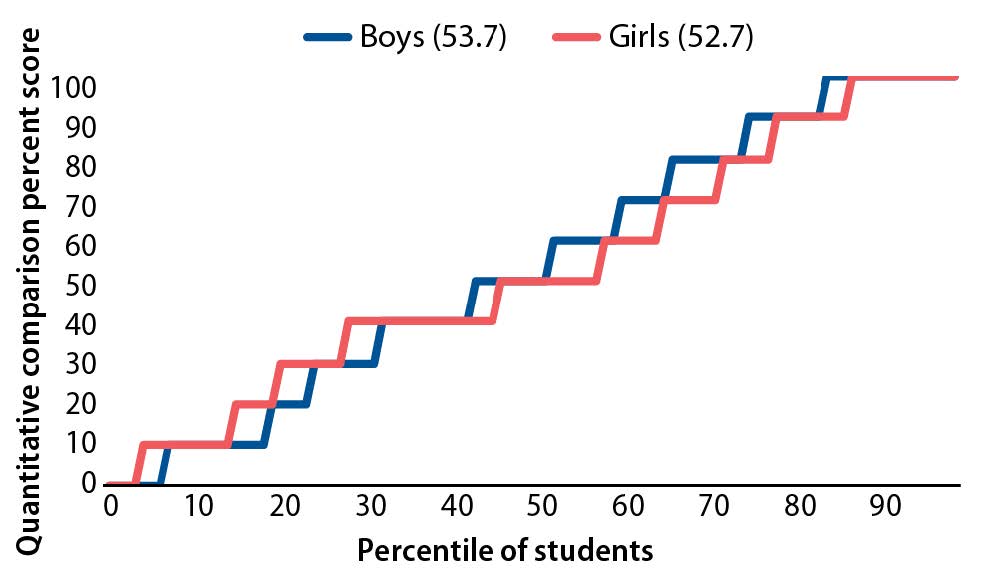
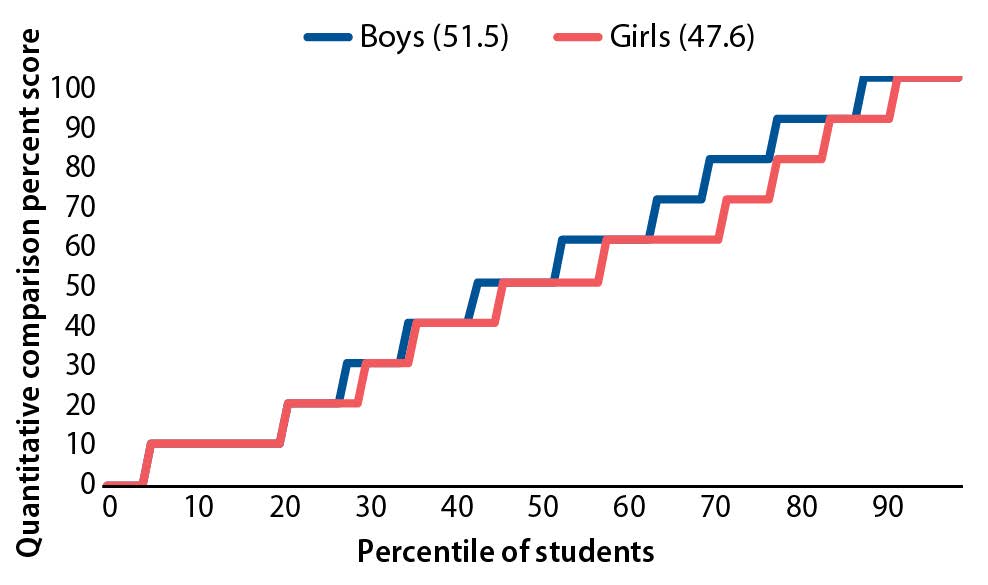
The picture that emerged for mathematics performance was very different than that for ORF. Figures 7 through 10 present cumulative distribution scores of boys’ and girls’ quantitative comparison skills, measured in percent score, from four sample countries. As shown in the bottom left-hand corners of the figures, lower-scoring boys and girls typically performed similarly—and in some cases, such as Egypt, girls did better than boys at the lower end of the distribution. However, as the graph lines move toward higher-scoring students, boys start to outperform girls. Boys’ quantitative comparison scores level off at the 100 percent score before girls’ quantitative comparison scores reach the same level. This analysis indicates that although these boys and girls began developing quantitative comparison skills at a similar rate, the skills accelerated faster for boys than for girls. The differences were more substantial for Liberia and Jordan than for Egypt and Tanzania. However, direct country comparisons cannot be made because of differences in factors such as sample size in the different studies.


In Liberia (Figure 7), the average score in grade 2 was 66.5 percent for boys and 59.5 percent for girls, a difference of 7 percentage points. Among boys, 2.9 percent scored zero, as did 6 percent of girls. Although scores increased relatively quickly for both boys and girls once learners moved past zero, boys consistently scored higher than girls across nearly all percentiles above the first.
In Jordan (Figure 8), the average score was 88.0 percent for boys and 82.3 percent for girls, a difference of 5.7 percentage points. Negligible percentages of boys and girls scored zero. Scores increased very rapidly after zero for boys and girls, with boys scoring higher than girls across the board and reaching the “ceiling,” or top possible score in the assessment, faster than girls.
Turning to Egypt, in grade 3 (Figure 9), the average score was 53.7 percent for boys and 52.7 percent for girls, a difference of only 1 percentage point. The closeness in averages reflects the fact that girls outperformed boys at the lower skill levels, with boys overtaking the girls at higher proficiency levels, as discussed above.
In the final example, from Tanzania (Figure 10), the average score was 51.5 percent for boys and 47.6 percent for girls, a gap of 3.9 percentage points. Girls and boys scored zero at the same rate and mirrored each other in the first few percentile categories. By around the 30th percentile, boys’ scores began to surpass girls’ scores to some extent, and boys reached the top possible score slightly earlier than girls.
This section has described patterns in reading and mathematics performance for boys and girls in the early primary grades across several lower- and middle-income countries. The next section discusses the implications of the findings presented in this section and describes the limitations that affected our analysis.
Discussion
In this section, we first discuss the implications of the findings for reading, followed by the implications of the mathematics findings.
Reading
Our findings that girls outperformed boys in reading aligns with research from other countries, as outlined in the background section of this paper. The commonalties seen across the diverse countries are compelling. Most concerning is that, even though the prevalence varied, Even if the data collections took place at different time points in grade 2 or grade 3, all the assessed children would have had at least one year of formal reading instruction before being assessed. The inability to identify a single word indicates that the instruction received did not align with students’ needs. Nevertheless, because more boys than girls remained at zero, the instruction was a slightly better fit for the girls.
Once the girls began to accurately read words, that skill contributed to reading that was more automatic, as evidenced by an accelerated oral reading rate. In other words, once they started reading, they separated even further from the boys. Our analysis also showed the degree of that separation; in multiple countries, girls read at a fluency rate that was a quarter to a half of a grade level above the boys.
Nevertheless, it is striking to see in all countries that even as girls outperformed boys, their performance trajectory still tracked with the boys. Girls never performed so much better that their average scores resembled those of girls from high-performing countries. Instead, they performed just a little better than the boys in their education system. Thus, although the girls had an advantage over the boys in their country, they did not dramatically surpass the country-level profile for the oral reading rate.
Certainly, each language has its own features; elements such as word length, syllable structure, syntax, and visual appearance of symbols all influence reading rate. For these linguistic and orthographic reasons and more, there is no global benchmark for reading rate, but there is a universal concept that as reading skills progress, reading rates become faster. During the first 2 years of formal reading instruction, an expected progression starts with no word-reading ability, then reading word-by-word, followed by reading some parts in meaningful phrases, to eventually reaching fluent reading. In a few data sets, boys and girls approached fluent reading on average, but not enough individual students approached it.
It is a realistic goal to have more students—both boys and girls—become fluent readers within 2 years of beginning formal reading instruction. First, to address the large number of students who cannot read a single word (i.e., the zero scores), an examination of grade 1 curriculum expectations is required. It is likely that children, particularly boys, have insufficient opportunities to develop the emergent literacy skills (e.g., print concepts, phonological awareness) necessary for becoming a beginning reader. Getting more boys beyond zero is not sufficient, however. The next step should be giving all students more opportunities to read and write grade-level words to improve their reading accuracy. Soon afterward, the focus of instruction should address improving reading rate through activities such as repeated readings, partner readings, and informal performances, such as “readers’ theater” (i.e., reading assigned parts of a text as if they were a script). As reading rates increase, attention should shift to reading with expression by attending to the punctuation, the word meaning, and the purpose of the text. By the end of grade 2, both boys and girls should be reading grade-level text and demonstrating the three components of ORF (Rasinski, 2006): accuracy, rate, and expression.
Improving reading fluency in the early grades is formulaic: it builds emergent literacy skills, then develops reading and spelling skills for accuracy, followed by increasing reading rate, and then expression, all done with text that has grade-level words and sentence structures, to provide developmentally appropriate practice. Improved ORF is not the ultimate goal, however; reading comprehension is. Nevertheless, with more-explicit attention to improving fluency in the early grades, boys and girls will be better-prepared to comprehend increasingly complex text and reach their full reading potential as they progress higher in education.
Mathematics
The findings from the four countries featured above with available data from the quantitative comparison subtask showed that although girls and boys tended to move off zero scores at about the same time, boys gained proficiency slightly faster. In all countries, boys’ average scores in grades 2 and 3 were higher than those for girls, although we found this difference to be clearer in Liberia and Jordan than in Egypt and Tanzania. Even with this slight difference, we did not see major gender gaps in performance; that is, scores for both boys and girls tended to track with each other, with girls’ scores being slightly behind those of the boys.
Echoing findings from the reading results, the overall performance in three out of four of the countries we examined was still quite low, considering how fundamental the knowledge of magnitude is for mathematics. This subtask also measures place value knowledge, the key to understanding how our number system is organized. Students who cannot identify the larger of two numbers with ease will struggle with all basic numeracy tasks.
Our findings confirmed patterns from high-income countries, where boys tend to outperform girls by the end of primary school even though they start at similar levels of achievement (Fryer & Levitt, 2010). Dickerson and colleagues (2015) examined data from 19 African countries and found that by the end of primary school, boys were outperforming girls in mathematics, evidence that this finding may be global. Across the four countries in this paper that assessed mathematics skills, we saw that by grades 2 and 3, boys were just beginning to outperform girls. This result foreshadows the pattern that, by the end of grade 6, boys often are significantly outperforming girls in mathematics (Dickerson et al., 2015; Fryer & Levitt, 2010).
Given the low overall performance, how can we best support higher numeracy outcomes for both boys and girls? Although many complicated factors affect improving learning outcomes in general, we can offer some specific recommendations for early mathematics. Instruction should focus on giving students multiple opportunities to practice skills in active learning environments; it is not enough for children to watch as the teacher counts four sticks and writes the numeral four on a blackboard or on the ground. Children must experience this concrete-to-abstract concept for themselves by counting the sticks and writing the numeral. At the same time, teachers in primary grades need more support doing and teaching mathematics with understanding. Teachers in many contexts struggle with mathematics themselves and need training to be able to understand foundational mathematics concepts.
In addition, it is clear from the analysis that we report in this paper, and from other research cited in the background section, that girls eventually lag behind boys in mathematics, and that this difference is likely caused by a complex interplay of social, political, economic, and cultural factors. We also know from this same research that the gender gap in mathematics steadily worsens throughout primary school. The early grades, before a gap is pronounced, might be the optimal time to intervene and prevent a larger gender difference from appearing. Many interventions focused on girls and mathematics tend to support girls in the later primary years and into secondary school. However, it could be that focusing on girls before a gap appears, in grades 1 through 3, might allow them to continue learning at levels on par with boys. More research is needed on how exactly to do this and on what types of interventions in the early years could best support girls in mathematics.
Limitations
A few limitations affected the research presented in this paper. The first limitation was that demographic and contextual indicators—such as age and student socioeconomic status—were collected inconsistently or defined differently in each country. As such, it was not possible to conduct analyses exploring the relative importance of a range of student and school-level background factors in predicting learning outcomes for boys and girls across different contexts. Second, there has been a call to conceptualize gender more inclusively in international development data collection and use (Colaço & Watson-Grant, 2021). However, USAID data sets traditionally have relied on binary male/female definitions for data disaggregation. The analysis presented in this paper could only be as inclusive as the source data, but the push for more-inclusive data collection should remain a priority in future learning assessments. Lastly, although we found many studies on early grade reading, there were far fewer mathematics assessments. This shortcoming limited the representativeness of the findings across contexts and is a key gap that should be addressed to ensure that mathematics is assessed more often in future studies—and that more interventions focus on improving mathematics skills in the first place.
Conclusions and Next Steps
We drew upon early grade reading and mathematics assessment data sets from multiple USAID projects in countries around the globe to investigate patterns in gender differences in early grade learning outcomes. By doing so, we hoped to address a gap in the literature related to understanding of learning outcomes for girls and boys in lower- and middle-income countries and for early primary school, in assessments that used common rather than disparate metrics.
Consistent with findings from assessments in upper grades and in wealthier countries, we identified in these data sets that girls consistently outperformed boys in reading, whereas the opposite was true for mathematics. The differences typically were not large, however. In reading, girls tended to start developing skills faster than boys, in some cases gaining half a grade-level difference. Nevertheless, their performance still tracked with the boys, indicating that they did not have a meaningful advantage over the boys. In contrast, boys gained proficiency in mathematics at slightly faster rates than girls.
Global experience shows that patterns of poor performance become more entrenched the further learners progress through the grades, suggesting that early interventions for boys in reading and girls in mathematics could have long-term benefits. At the same time, both girls and boys typically scored below expectations in the two subjects across countries, meaning that targeted strategies to improve outcomes for both genders are needed early in their educational trajectories. Research may be required to identify the most-effective strategies, particularly in mathematics. The fact that mathematics assessments have been conducted relatively less often than reading assessments in the types of early grade learning programs in lower- and middle-income countries that we covered in our analysis also underscores the need to gather data on student mathematics skills more frequently so the international education community can better understand the extent of the challenges worldwide.
Acknowledgments
This research was funded by RTI International through an internal research and development award focused on gender in international education. The research team used data sets from education projects funded by the United States Agency for International Development (USAID) to conduct the analysis described in this report. The data sets were approved for sharing through USAID’s Development Data Library (https://data.usaid.gov/) by the relevant authorities.
RTI Press Associate Editor: Jeffrey Rosen