Introduction
Address-based sampling (ABS) in the United States usually refers to sample surveys of residential addresses from a frame of addresses derived from US Postal Service (USPS) files (AAPOR, 2016). ABS has become increasingly popular because it reduces the costs of producing frames for face-to-face surveys and reduces costs and improves response rates over random digit dial surveys by using mail contacts and mail or web response modes.
The USPS files that ABS frames are based on were built for delivering mail. The resulting frames retain many features relevant to mail delivery. Sampling statisticians should understand these features and their nuances when designing ABS surveys. One such feature is a flag or indicator for drop points.
A drop point is an address that serves as the mail delivery point for multiple housing units that do not have unique identifiers, such as apartment numbers or lot numbers. The housing units served by a drop point are called drop units. Typically, the address frames based on USPS files identify the addresses that are drop points, along with the number of drop units associated with each drop point. (See Amaya, 2017b for more information on drop points and drop units.)
For surveys with mail contact mode, drop points cause special logistical challenges. Suppose a single unit at a drop point is selected into the sample. The introductory letter, questionnaire, reminder notices, and promised incentives cannot be directed to the selected drop unit without names or other unit identifiers. Alternatively, if a drop point address is selected into the sample in a two-phase selection, all of its drop units could be selected as well. Mail could be sent to all units at a drop point in hopes that the mail will, in fact, be distributed to each of the units. However, if the mail is distributed to the drop units by the residents themselves and not by an on-site employee, the sample could be subjected to self-selection bias, especially if the mailings include pre-paid cash incentives. For that matter, an on-site employee might not distribute mail to the units as intended. A third option is to remove drop points and drop units from the sampling frame, which incurs coverage error. The authors propose a fourth approach: sample substitution. That is, replace a selected drop unit with a designated substitute housing unit.
This paper introduces the idea of sample substitution for drop units selected into address-based samples for web and mail surveys where the contact mode is mail. The 2020 Residential Energy Consumption Survey (RECS) implemented drop unit substitution. After a brief comment on sample substitution literature, we present the method of selecting the substitutes for RECS as illustration. Alternative methods of selecting substitutes may be more appropriate for surveys with a different substantive focus. Validation of drop unit substitution is in the exploratory stages, but we discuss preliminary investigations. The paper concludes with discussion of the RECS application and drop unit substitution generally.
Sample Substitution in the Literature
Nishimura (2015) summarized the literature on sample substitution methodologies. Early textbooks (e.g., Kish, 1965) either did not mention sample substitution or discouraged its use, even though sample substitution is not uncommon in practice (Smith, 2007). In the literature, most substitution was performed to replace nonresponding units in the sample for face-to-face or telephone interviewing after the original nonresponding sample units refused or could not be contacted. Chapman (1983; 2003) and Vehovar (2003) discussed the advantages and disadvantages of sample substitution for unit nonresponse by these modes. One concern with substitution for nonresponse was that the substitutes that responded may be like the original respondents, not the original nonrespondents. In the nonresponse context, the substitutes would not mitigate nonresponse bias and may actually increase the bias. (Vehovar, 1999 provided a theoretical account of bias when substituting for nonresponding units.) Sample substitution for nonresponse was especially problematic when the interviewers selected the substitutes and when the resources for collecting data from the substitutes were more limited than in the initial phase of data collection. These concerns are not relevant for our application.
Our idea is to substitute for the drop units in mail contact surveys before any selected households are given a chance to respond (i.e., before data collection). In this scenario, there is no interviewer influence and no issue with sequential data collection. Our assumption regarding nonresponse bias is that the propensity to respond has nothing to do with whether the street address includes individual unit numbers or whether the original units and their substitutes would respond at similar rates if given the chance and the same protocol. It is true that substitution can introduce substitution bias if the drop units and the substitutes are not very similar. Our assumption regarding substitution bias is that the substitutes as a group respond the same way that the residents of drop units would have responded. One way (but not the only way) to make the substitutes as a group as much like the drop units as possible is to make each substitute unit a good match for the individual drop unit it replaces. In other words, good pairwise matches make for a good match at the aggregate level.
Chapman (1983; 2003) noted that substitution can preserve the original sample design and sample size. Depending on the selection and matching algorithms, substitution may actually reduce bias and the mean squared error (MSE). In our application, substitution bias may be much smaller than the coverage bias of omitting all drop units, so the MSE may be smaller with substitution.
Magnitude of Drop Point Issue
How common are drop points, and how widespread is the challenge of handling them? Amaya (2017a) summarized the extent and distribution of drop points and drop units in a 2016 ABS frame. Drop points constituted 0.5 percent of unique residential addresses in the United States, representing 1.5 percent of housing units. Because these percentages are small, national surveys that choose to remove them from the frame would incur the 1.5 percent coverage error, which increases the potential for bias only modestly. Even if drop points are included in the sample of a national survey, documentation often glosses over the handling of them.
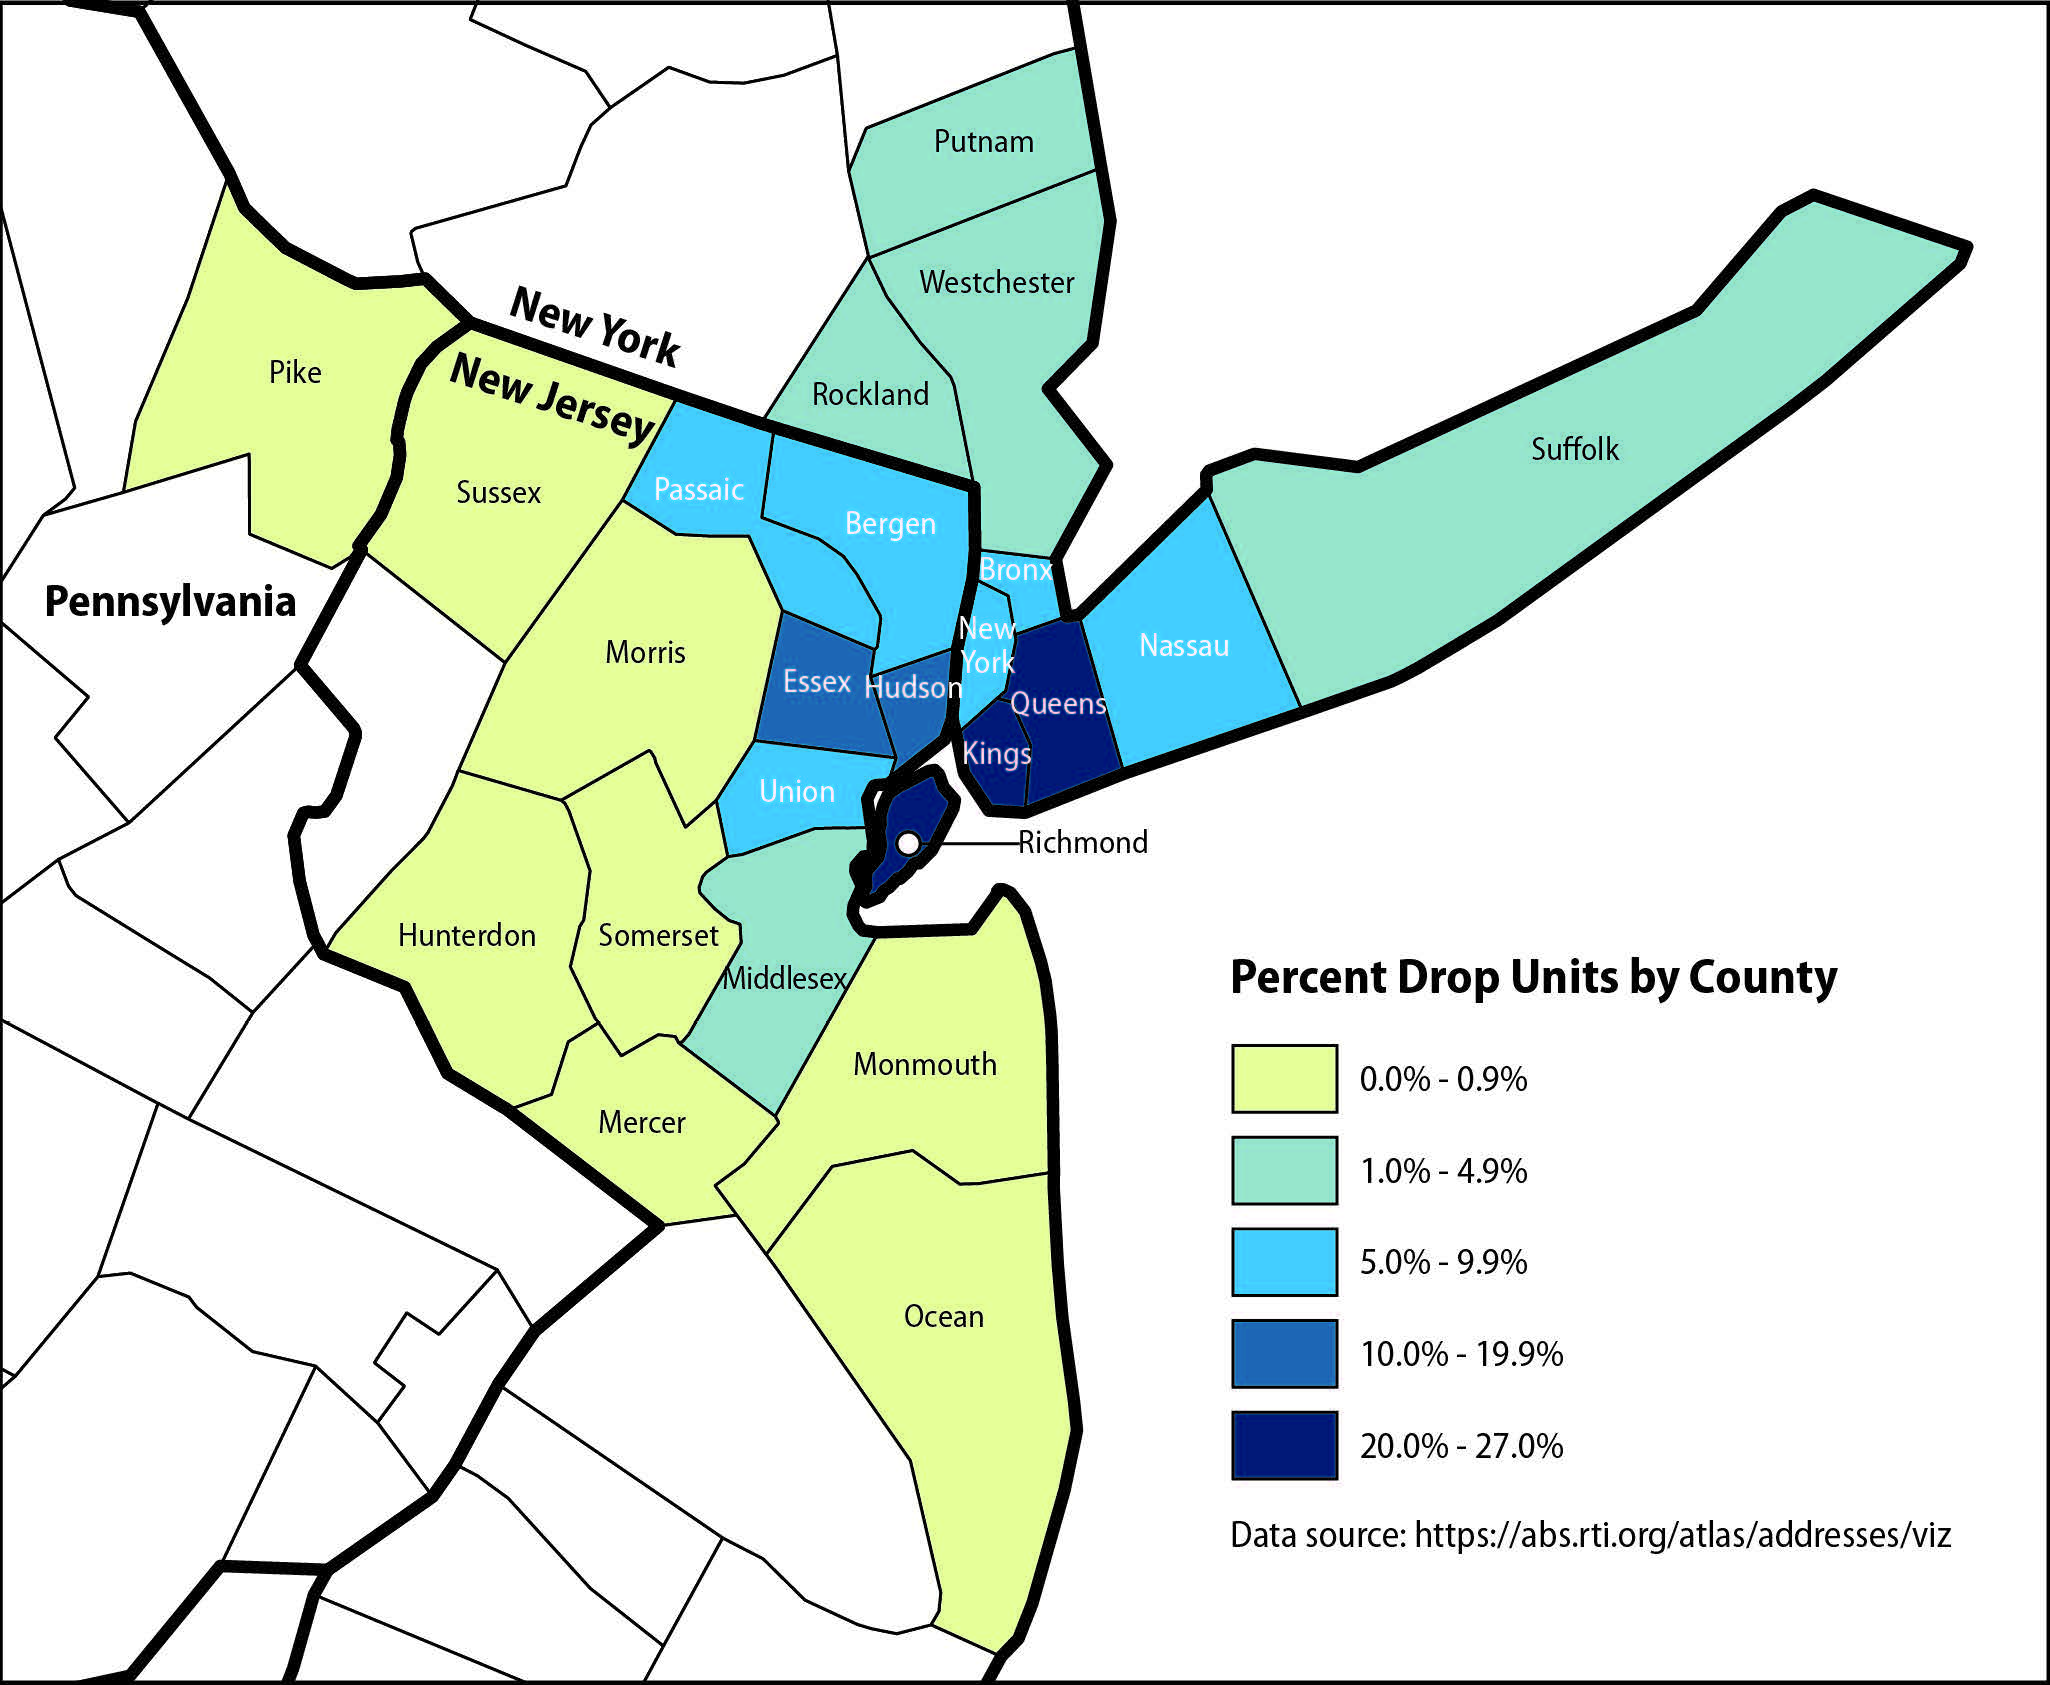
However, drop points are not evenly distributed throughout the United States. They are most common in a few larger, older cities, such as New York, Boston, and Chicago. Amaya (2017b), Clark & Moul (2003), and Dekker, Amaya, LeClere, & English (2012) indicated that a higher density of drop points is associated with higher proportions of older buildings, households with children, Black and Hispanic residents, lower socioeconomic status, and lower rates of owner occupancy. Subnational surveys and surveys making estimates for subnational areas could have serious coverage problems if drop points are excluded. For example, in the county of Queens, New York, drop units account for 27 percent of housing units (McMichael, 2017). Figure 1 shows the percentage of drop units by county in the New York/Newark/Jersey City Metropolitan Statistical Area.

Many drop points were originally single-family homes that had been converted into apartments (Amaya, 2017b). Consequently, most drop points nationally (589,807 or 80 percent) have two units (Amaya, 2017a). Only a small percentage of drop points have more than four units. Table 1 shows the states with the largest percentages of drop units. If drop points with more than four units are omitted from the frame, the loss of coverage from this omission is estimated to be 0.4 percent nationally and no more than 1.4 percent for any one state.
Implementation of Drop Unit Substitution for the Residential Energy Consumption Survey
We employed drop unit substitution for the sample of housing units selected for the 2020 RECS. RECS is a nationally representative study of the characteristics and energy consumption of homes occupied as a primary residence. Recently, RECS converted from an in-person survey to self-administered web and mail modes exclusively (US Energy Information Administration, 2020). This change in administration also reduced costs, allowing the RECS to increase the overall sample size and produce certain estimates at the state level for all 50 states and District of Columbia for the first time in the program’s history. However, because the 2020 RECS was designed to produce state-level estimates and the absence of drop units could bias estimates for some states, a methodology to include drop units in the sample was needed.
We removed larger drop points with five or more drop units from the frame with minor coverage loss, as shown in Table 1. Drop units in drop point buildings with two to four units remained eligible for sampling in the RECS frame, and we selected drop units along with other housing units directly without a two-phase approach of selecting drop points first. However, because of the difficulties of targeting a specific drop unit with mailings and incentives, we replaced the selected drop units with substitutes. These substitute units came from multiunit buildings with the same number of units as the building for the sampled unit, but the buildings supplying the substitute units were not drop point buildings. The substitute unit essentially served as a proxy for the selected unit.
In the literature, substitutes may be selected randomly or purposively. If random, the substitutes may nevertheless be stratified or selected based on a common auxiliary variable. In our illustrative example, we selected the substitutes by a mix of purposive and random mechanisms using an auxiliary variable. We selected the substitute unit (randomly) from the building with the same number of units (auxiliary variable) closest to the drop point geographically (purposively). Our assumption for RECS was that units in buildings of the same size in the same geographical area with the same climate and the same options for energy providers are more alike in their energy usage than substitution pairs selected completely at random. Although physical proximity and number of units were the selection criteria for RECS substitutes, substitutes for other surveys might be based on other characteristics in the frame that are more closely associated with the purpose of the survey.
The rules used for selecting a substitute unit for RECS can be described simply in three steps:
-
Identify other non–drop point buildings with the same number of units; these buildings are considered candidate buildings.
-
Select the nearest candidate building as the substitute building.
-
Randomly select a housing unit within the selected substitute building.
Although the rules can be described simply, the implementation involved some nuances. The most complicated part was determining the set of units that comprised a non–drop point building, which was possible only by having access to the entire frame in-house. First, we identified addresses with the same base street name and number. We identified most non–drop point buildings by simply ignoring the secondary address information (apartment or unit identifiers). For example, 123 MAIN ST APT A and APT B would be identified as two units in the same building when the secondary address fields were ignored. More-complex addresses included unit designations in the street number, such as 123A MAIN ST and 123B MAIN ST. We identified these addresses and parsed them to separate their base street number and unit identifier. We appended the building identifier to the frame.
At that point, determining the number of units corresponding to each building was relatively simple. The frame also had a drop point indicator for each address and the number of units for each drop point. Using the number of drop units and the newly created building size variable, we could identify the set of candidate substitute buildings for any selected drop unit.
The nearest building was identified by calculating the distance between geocoded coordinates. Although we considered walking sequence within carrier route (available on the frame) for the distance algorithm, for the sake of simplicity, we decided to use the SAS® function GEODIST to calculate the geodetic distance between geocoordinates (Geodetic distance takes the curvature of the earth into account but will be nearly identical to straight-line Euclidean distance over relatively short distances).
We selected the nearest candidate building as the substitute building. Next, we selected a housing unit within the building at random to be the substitute unit. Technically, we selected the substitute unit among the units that had not already been selected for the RECS sample, either directly or as a substitute. In simulations to test the procedure and in production for RECS, though, no building would have been selected more than once because of substitution.
Since developing this substitution methodology, we and our colleagues have applied versions of it to three subnational surveys with high concentrations of drop points: the 2020 Healthy Chicago Survey (Chicago Department of Public Health, 2020), the 2021 Healthy Chicago Survey (in production), and the 2020 New York State Problem Gambling Prevalence Survey (New York State Office of Addiction Services and Supports, 2021).
Preliminary Exploration of Validity
Validation of the substitution method can be considered in three ways. First and most importantly, what is the effect on MSE and bias from using substitutes? Unfortunately, the RECS data do not include responses from the selected response units for this comparison. With suitable weights, it would be possible to compare MSEs of estimates from the responding sample (including substitutes) with MSEs from the sample, excluding both drop units and substitutes, but that has not yet been done.
Second, do the substitutes as a group respond to the survey in the same way that the drop units would have responded? Aggregate similarity controls substitution bias when means and totals are being estimated. Again, we do not have the data to evaluate the survey responses for drop units, but similar housing unit characteristics and geography can be a reasonable proxy. We know from the way we selected the substitutes for RECS that the substitutes represent the same general geographical areas and multifamily buildings with the same numbers of units.
Third, is each substitute like the drop unit it replaces? That is, do we have good pairwise similarity? For RECS, for example, do the drop unit and its substitute have similar housing characteristics and energy consumption? Good pairwise matches will control substitution bias for modeling as well as for estimating means and totals.
Validation of the drop unit substitution method is in the early, exploratory stages. On average, we expect the selected drop units as a group and their substitute units as a group to be similar in housing unit characteristics (using the RECS match criteria) or in household characteristics (if we had used demographic match criteria), but we do not necessarily expect each sample drop unit to be similar to its selected substitute. Even so, we might expect multiunit buildings near each other to have similar neighborhood demographics, similar periods of construction, and possibly even the same developer. We conducted limited reviews of pairwise comparisons to explore whether pairwise similarity was a reasonable expectation.
Table 2 summarizes the distribution of distances between selected drop units and selected substitute units for five simulated national samples. We expected each simulated national sample of size 48,649 (the intended size of the RECS sample) to include more than 600 drop units, and the average number n across the five samples was 631, most of which were in drop points with two units. Overall, the median distance between a drop unit and its substitute was approximately 62 yards. Seventy-five percent of the distances were less than a tenth of a mile. More than 90 percent of the distances were less than a mile. Therefore, most substitute units were reasonably near their paired drop unit. Nearness gives some hope of pairwise similarity for many drop unit/substitute pairs.
“Near” is a relative term, depending on the density of the neighborhoods. Pairs farther apart tended to be in areas where multifamily buildings are less dense, especially for buildings with exactly four units. Pairwise similarity may not be reasonable for pairs farther apart.
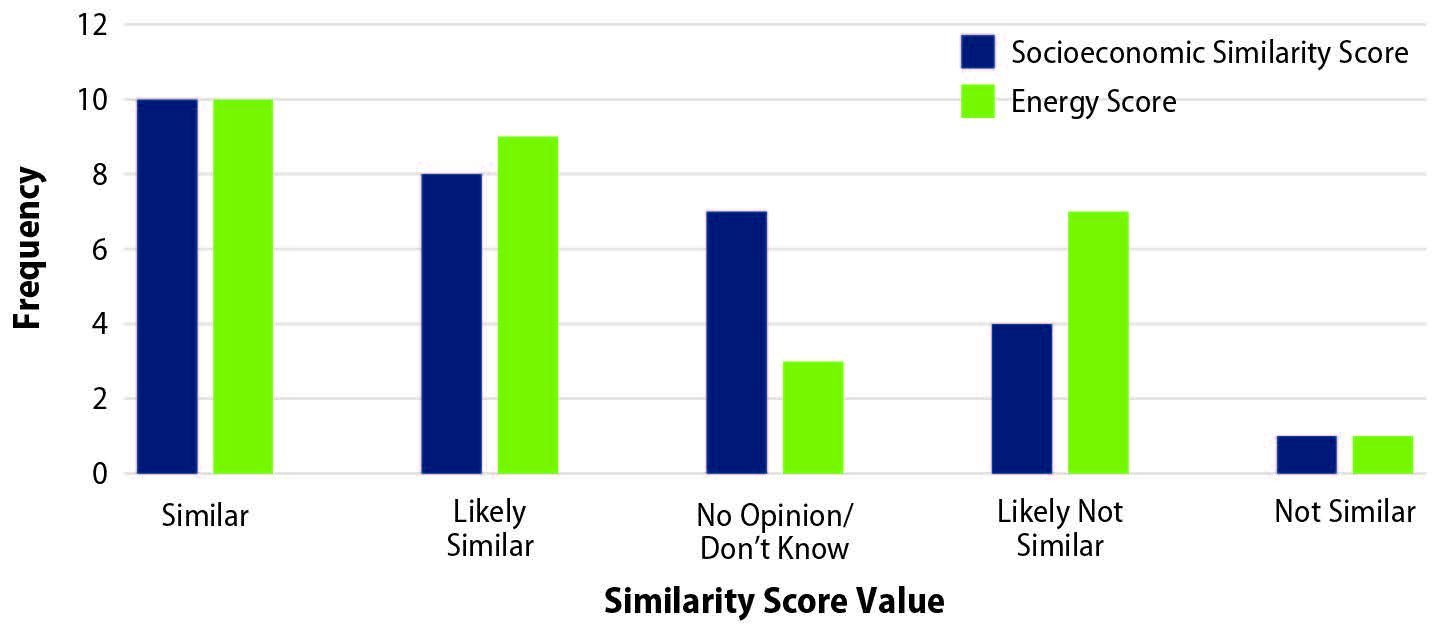
As a concept test to help understand differences between drop units and their paired substitutes, we informally compared a small sample of 30 drop units and their substitutes in New York City using online resources, including Google Street View, Zillow, Redfin®, and county property tax records. Some variables were at the unit level, but images and other variables corresponded to the buildings, not the individual units. We gave each pair two scores along a five-point scale using what could be discerned from online sources. We evaluated socioeconomic similarities using factors such as rent, size, and condition of the property. We evaluated energy use similarities using type of structure, size, building materials, and presence of window unit air conditioners. We assigned pairs of drop units and substitutes (or their buildings) two subjective similarity scores, defined as follows:
-
2–Similar
-
1–Likely Similar
-
0–No Opinion/Do Not Know
-
-1–Likely Not Similar
-
-2–Not Similar
The Appendix displays the scores and observational comments for each pair . The distributions of the scores in Figure 2 show that the pairs are more similar than dissimilar, on average, but not for all pairs. The results cannot be generalized because of the small sample size, the quality of information that was gathered online, and the subjective nature of the evaluation. Informally, however, the results confirmed that drop unit substitution does not guarantee pairwise similarity. Therefore, we did not continue pairwise comparisons with this sample.

More research is needed to investigate pairwise and aggregate similarity. A test is underway involving the 2021 Healthy Chicago Survey to provide a more rigorous validation of drop unit substitution. We mailed an invitation to participate in the health survey to a sample of drop units and their substitutes. Furthermore, we sent all drop units at the drop point addresses the same materials. The responses via web and mail will shed light on the pairwise and aggregate similarities in propensities to respond and household demographics for respondents, but not characteristics of the housing units, because those are not collected in this particular survey. An exciting aspect of the 2021 Healthy Chicago Survey comparison is the ability to compare survey outcomes and MSEs with the drop units, with the substitutes, and excluding drop units altogether.
Discussion and Next Steps
The purpose of this paper was to introduce the concept of drop unit substitution in ABS samples for mail and web surveys. The specific methods used to select the substitutes for the RECS sample are illustrative, as substitutes can be selected in other ways. The RTI team will demonstrate the statistical properties of drop unit substitution as implemented by the RECS approach in a future paper using data from the 2021 Healthy Chicago Survey.
The match criteria for selecting substitutes in RECS were physical distance and the number of units in the building. The number of units is not readily available in ABS frames for buildings that are not drop points, so generating building indicators required some custom work. It is debatable whether the substitute really needed to have the same number of units as the drop point with the selected unit. Many drop points were built as single-family homes and later converted to contain a separate apartment (Amaya, 2017b). These 2-unit drop points are not much like larger buildings constructed to be multifamily apartment buildings or condos. To some extent, then, size matters.
Calculating physical distance requires addresses to be geocoded, which is often done for ABS surveys anyway. Physical proximity was important for RECS because energy usage is dependent on weather and climate, which would be the same for neighboring buildings. For surveys about other topics, such as marital happiness, physical proximity may or may not take precedence over other match criteria, such as neighborhood demographics.
Beyond physical distance and building size, there is very little in an unadorned ABS frame on which to base a match. However, geocoded addresses enable auxiliary data from other sources to be appended to the frame. It is common to append area-level variables such as demographics from the American Community Survey at the census tract or census block group level. Substitute units that are physically near the selected drop units will often have the same values of the area demographics. Having similar demographics may be more important for areas where nearby substitutes cannot be found.
Building characteristics such as year built, construction material, square footage, building footprint size, or housing unit cost would make nice match criteria for RECS, if available. Nationally, no complete list of buildings exists, so it is not possible to append a file of building characteristics to the entire frame. Some cities or states have building registries or other administrative files for building codes, energy efficiency status, real estate records, or property taxes, for example. Some files will be more complete than others. It may be impractical to piece together data in different forms for different geographical areas, if one could even gain access to the data. Still, for a local survey, an investigation of additional data sources may be worthwhile. As long as the substitutes match the selected drop units in aggregate, though, pairwise similarity is less of a concern.
Acknowledgments
The authors thank the Energy Information Administration for sponsoring our work on the 2020 Residential Energy Consumption Survey (RECS) and thank Paul Biemer, the senior designer of the 2020 RECS sample. We acknowledge Kate Mills for pairwise comparisons of drop units and their substitutes and Taylor Lewis for leading the upcoming validation of the substitution method. We also thank Carolyn Hronis and Katie Lewis for reviews and helpful suggestions.