
Introduction
Most US hospitals are classified as nonprofit hospitals (American Hospital Association, 2021a). Nonprofit hospitals receive tax-exempt status partially in exchange for investing a portion of their operating budgets into the communities they serve. Spending that occurs through this investment is called “community benefit spending” and is meant to improve population health by addressing the community’s health-related needs (James, 2016). Community benefit spending has been in existence since the 1950s (Rosenbaum et al., 2015) and was originally focused on providing health care for patients unable to pay (James, 2016), typically referred to as “charity care.” Since then, community benefit spending has evolved and expanded beyond charity care to include community-building activities such as (but not limited to) research, economic development, workforce development, and community health improvement advocacy (American Hospital Association, 2021b; James, 2016).
To ensure that these community benefit funds go to the most-crucial community health need(s), the Affordable Care Act introduced a mandatory Community Health Needs Assessment (CHNA) to be completed every 3 years (Internal Revenue Service, 2021a). The purpose of CHNAs is to have local hospitals gather community input to better inform their community benefit spending and implementation strategy. Although nonprofit hospitals are required to conduct CHNAs and annually report community benefit spending to the Internal Revenue Service (IRS), no federal regulations direct how this spending should be allocated (Bannow, 2019). The IRS data are gathered through Schedule H (Form 990; https://www.irs.gov/charities-non-profits/form-990-resources-and-tools) (Internal Revenue Service, 2022a) and are publicly available but can be challenging to comprehend and analyze (Massoglia, 2016). Further, these data can be vague, making it challenging to quantify the value of hospital spending (Bannow, 2019).
To make community benefit spending data more findable, accessible, interoperable, and reusable (FAIR) (Wilkinson et al., 2016), RTI International, with support from the Robert Wood Johnson Foundation (RWJF), developed the Community Benefit Insight (CBI) platform (https://www.communitybenefitinsight.org/), which launched in 2017. CBI is a publicly available, web-based resource that aggregates these publicly available data reported to the IRS on US-based nonprofit hospital community benefit spending. By making data accessible, searchable, and easily understandable, CBI can be used to inform conversations and partnerships between nonprofit hospitals and community stakeholders such as health care practitioners, public health officials, researchers, and policymakers. This paper describes the development of the infrastructure that supports CBI’s capabilities, how IRS-released community benefit spending data are prepared and maintained for CBI’s use, how the tool is currently used, and how it is being expanded.
CBI Infrastructure and Management
CBI’s Development
In 2014, CBI began as a password-protected prototype called “Community Benefit Web Tool.” Various users, including hospitals, public health agencies, policy makers, and community organizations and coalitions, tested CBI. RTI then further developed and evaluated CBI, asking for input from internal stakeholders, such as hospitals, and external stakeholders, including those who were active in sharing their community benefit information and those who might benefit from broader sharing of this information. All external stakeholders were consumers of the information on Form 990 Schedule H, Part 1. RTI also formed an expert panel to help identify user requirements and guide the team’s efforts to capture and display CBI data. Panelists included researchers who were experts in analyzing the Form 990 data and who had ties to key stakeholder organizations. Software development efforts followed an “agile” process, which divided work into short, repeatable phases that allowed for deployments and updates to quickly be executed, integrated, tested, modified, and published for preview before being released to users. After adding to, modifying, and improving the tool, the team renamed it “Community Benefit Insight” and publicly launched it in 2017.
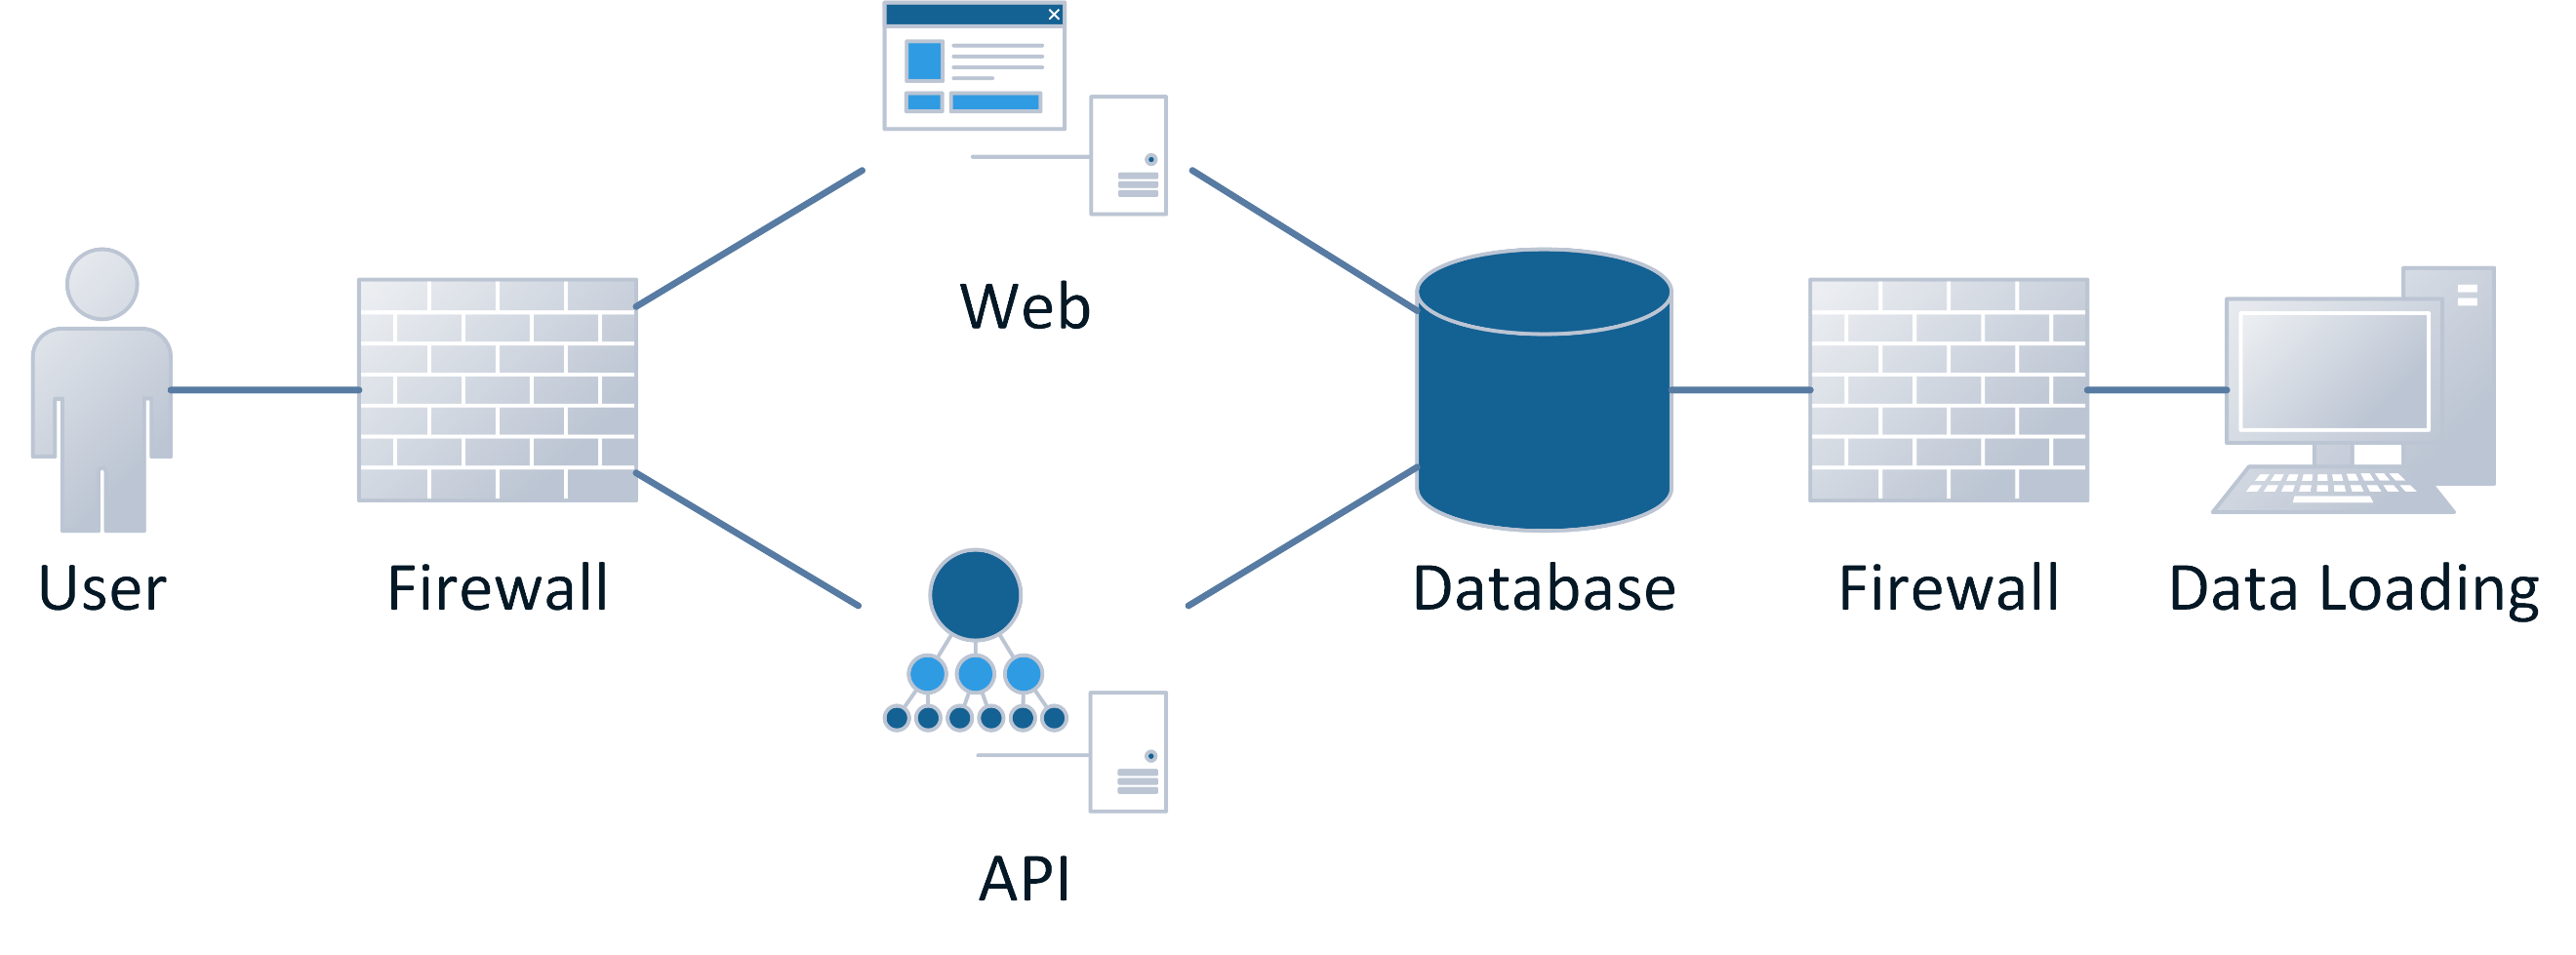
RTI developed the CBI website using the scripting language PHP (https://www.php.net/) and an open-source relational database MySQL (https://www.mysql.com/). The website is hosted on Apache web servers using additional JavaScript (ECMA International, 2021) libraries such as jQuery (https://jquery.com/) and D3 (https://d3js.org/) for user interface interactions and data visualizations. The MySQL database supporting CBI houses multiple tables containing nonprofit hospital data. Figure 1 outlines CBI’s technical infrastructure. Visitors can access the CBI website and its available application programming interfaces (APIs). The CBI website’s firewall filters and monitors visitors’ access and use. The CBI website and APIs interact with the CBI database to retrieve nonprofit hospital data and store data about visits. The CBI database is populated and updated using a data loading process, which transmits data through a firewall that filters, restricts, and monitors traffic to ensure only authorized users can access and update the database.

Community Benefit Data Management
All tax-exempt organizations must file an IRS Form 990 (Internal Revenue Service, 2022a), which is publicly available. Up until 2022, the IRS regularly published Forms 990 in an XML format from an Amazon Web Services data repository. Beginning in 2022, the IRS has made the returns available via their website in both XML and PDF format (Internal Revenue Service, 2021b). However, form submissions from nonprofit hospital facilities are only a small proportion of submissions from all tax-exempt organizations. Receiving and reviewing the forms from only nonprofit hospitals in a timely, cost-effective manner is challenging. To overcome this barrier, RTI searches the XML formatted returns twice per year for tax-exempt organizations that operate hospital facilities. To do this, RTI uses source data from IRS-exempt organization master files and internally maintained historical crosswalk files.
Data elements about nonprofit hospital facilities other than IRS data are obtained from the Centers for Medicare & Medicaid Services (CMS) and other publicly available sources. RTI creates a crosswalk between Employer Identification Number (EIN) (Internal Revenue Service, 2022c) and CMS Certification Number (CCN) by matching the tax-exempt organization’s Schedule H data to a CMS Provider of Services file. RTI then conducts complex scheduled and manual matching of hospital addresses and names. Matches are confirmed with a visual inspection of a sample of matches. The match rate is effectively 100% because an IRS record must match a CMS record of the desired facility type. RTI maintains the crosswalk semiannually, which eases tracking of nonprofit hospital ownership and EIN changes over time and helps with the process of obtaining data from many sources. However, the hospital status information from CMS is not always in alignment, and there is no expected total number of nonprofit hospitals to use as the denominator when evaluating data completeness. Therefore, RTI estimates, but cannot confirm, that in any given year, data are available for more than 95% of nonprofit short-term acute, children’s, and critical-access hospitals with an active CCN.
Community Benefit Data Visualization
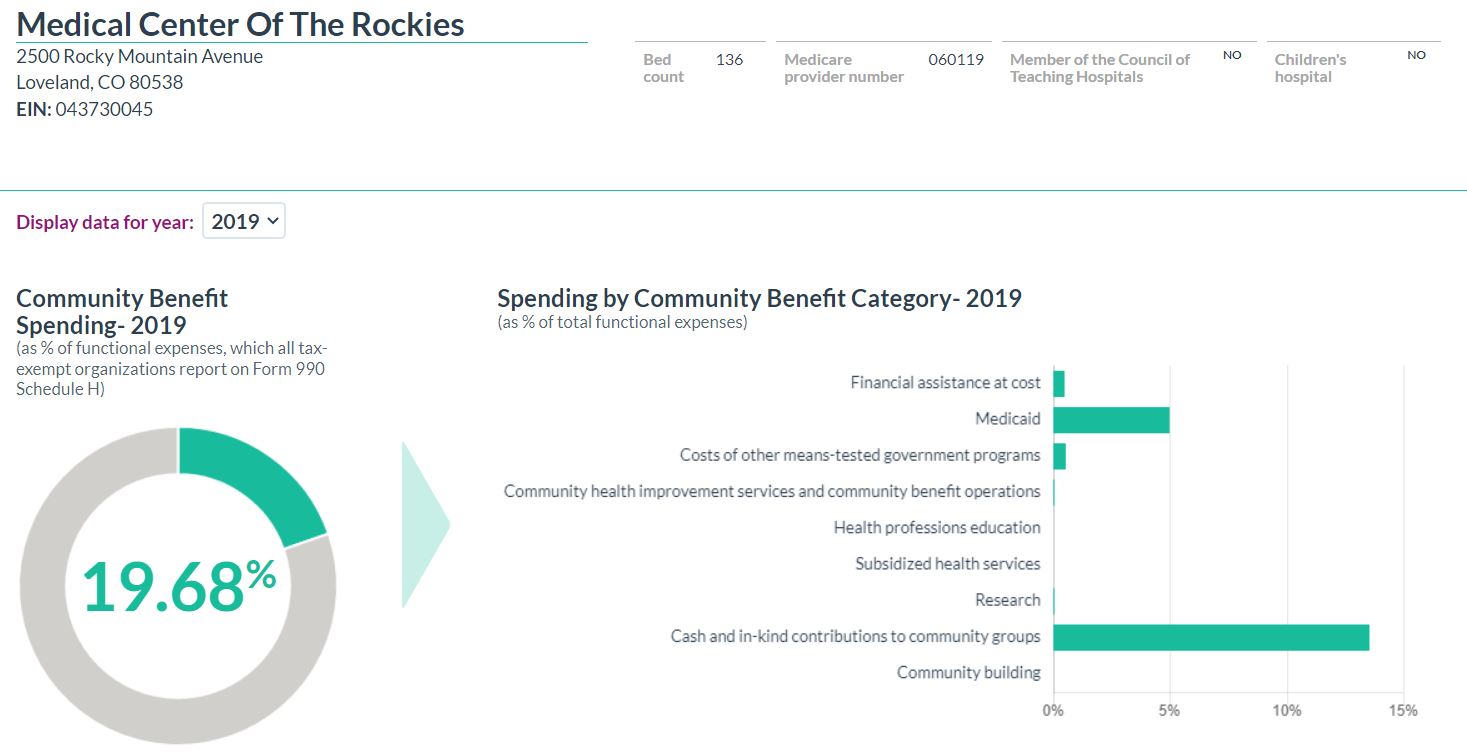
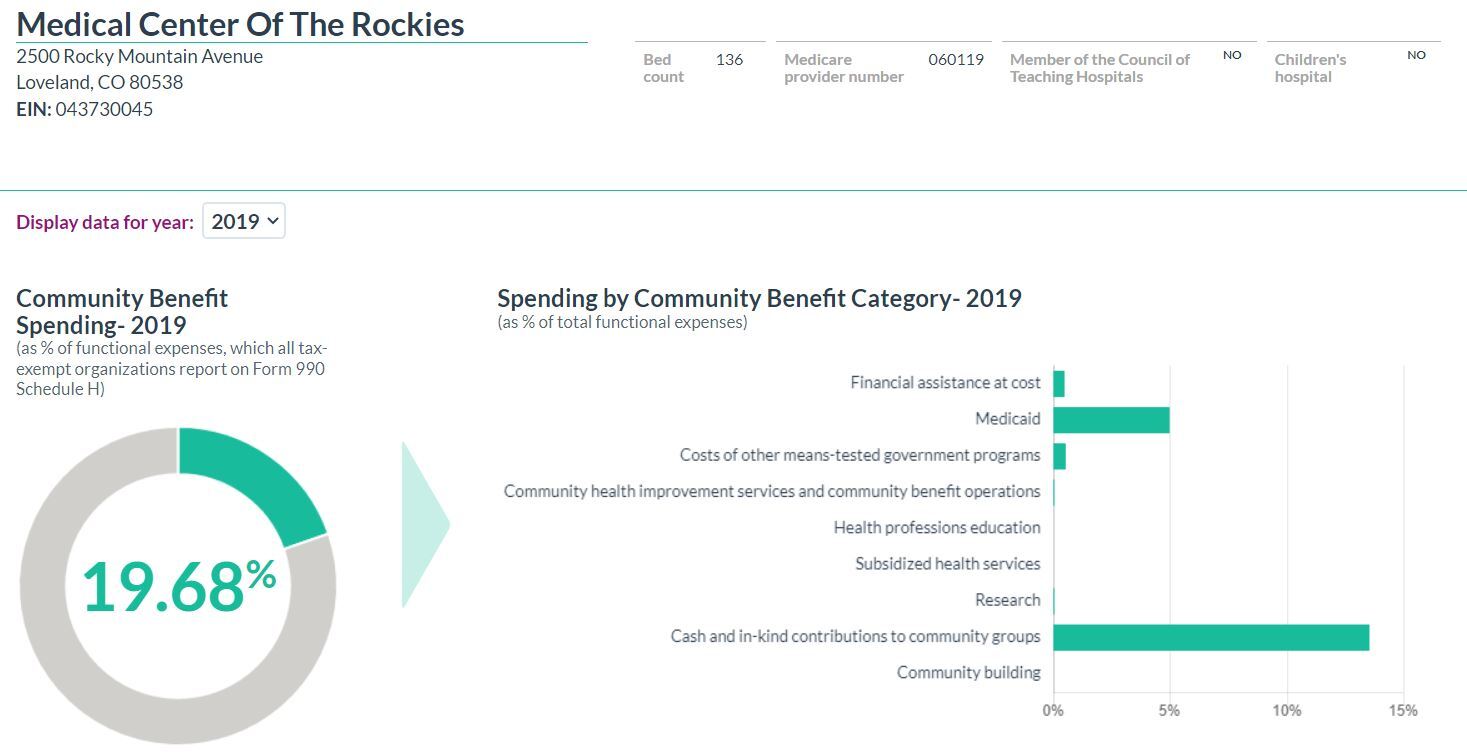
The CBI team aims to display data using a clear, user-friendly interface, making information easy to find and interpret. To improve understanding of this complex topic, CBI uses contextually linked (clickable text) explanations, definitions, and “helper text.” CBI primarily presents financial information on community benefit spending at the level of individual tax records. Because some nonprofit hospital facilities are operated by a parent organization that is the tax reporter, CBI presents community benefit financial data at the level of the tax reporting entity (sometimes a single overarching organization) and provides additional detail available for individual hospital facilities. Once the user has selected a tax year, tables and interactive charts display data from the chosen year (Figure 2).
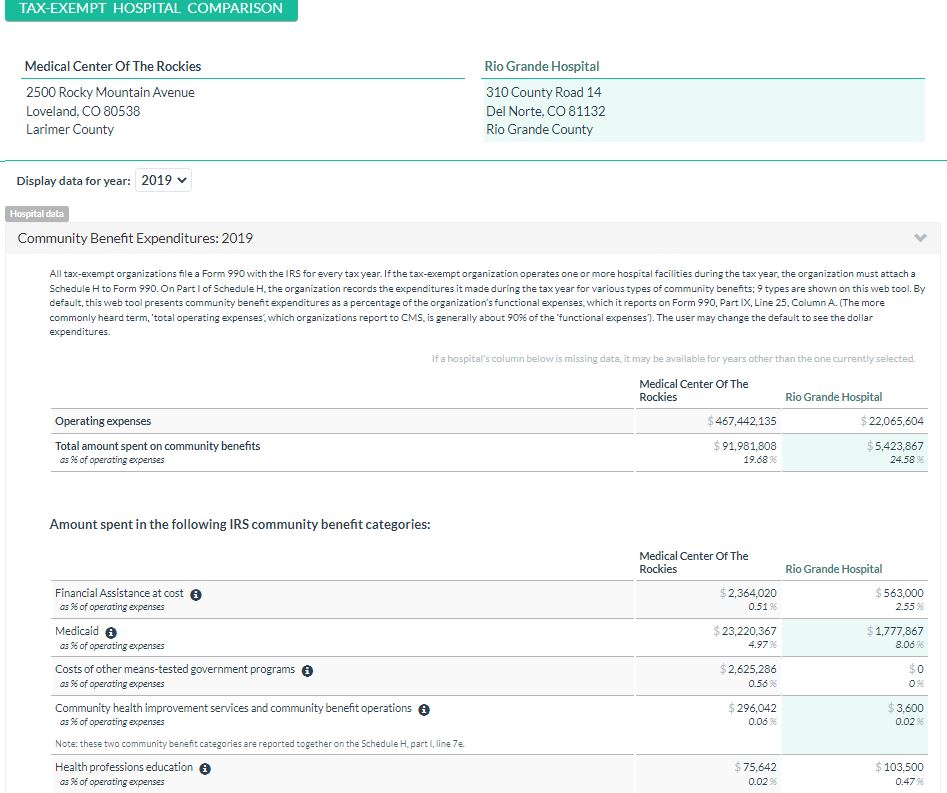
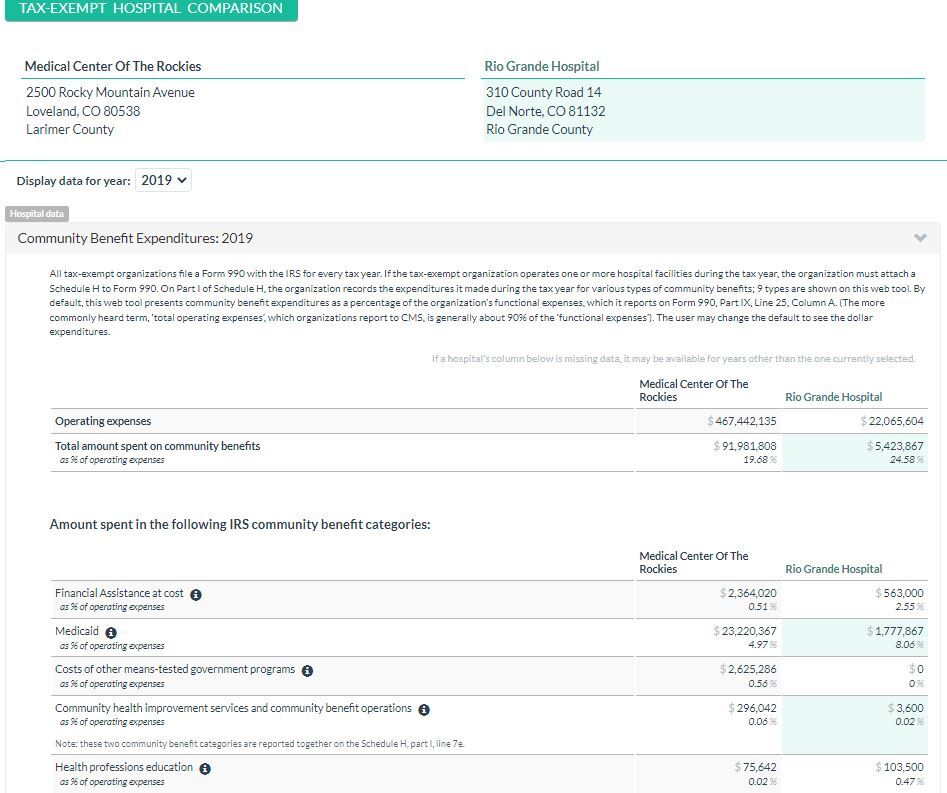
CBI also allows users to review community benefit spending across multiple reporting entities in a table for easy comparison across spending categories (Figure 3).
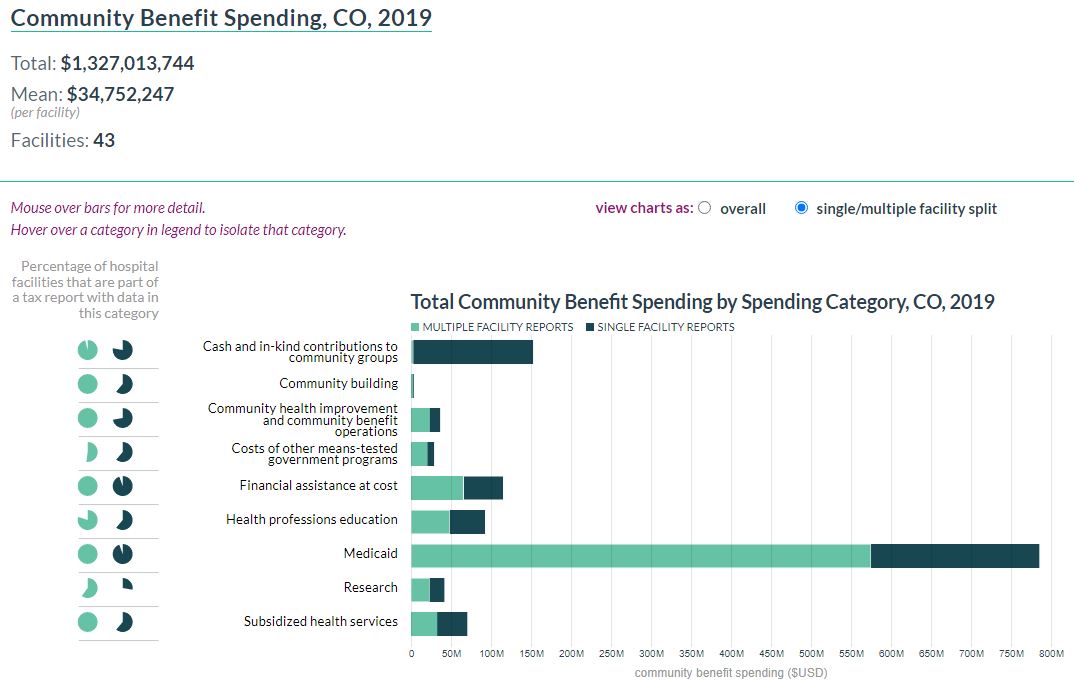
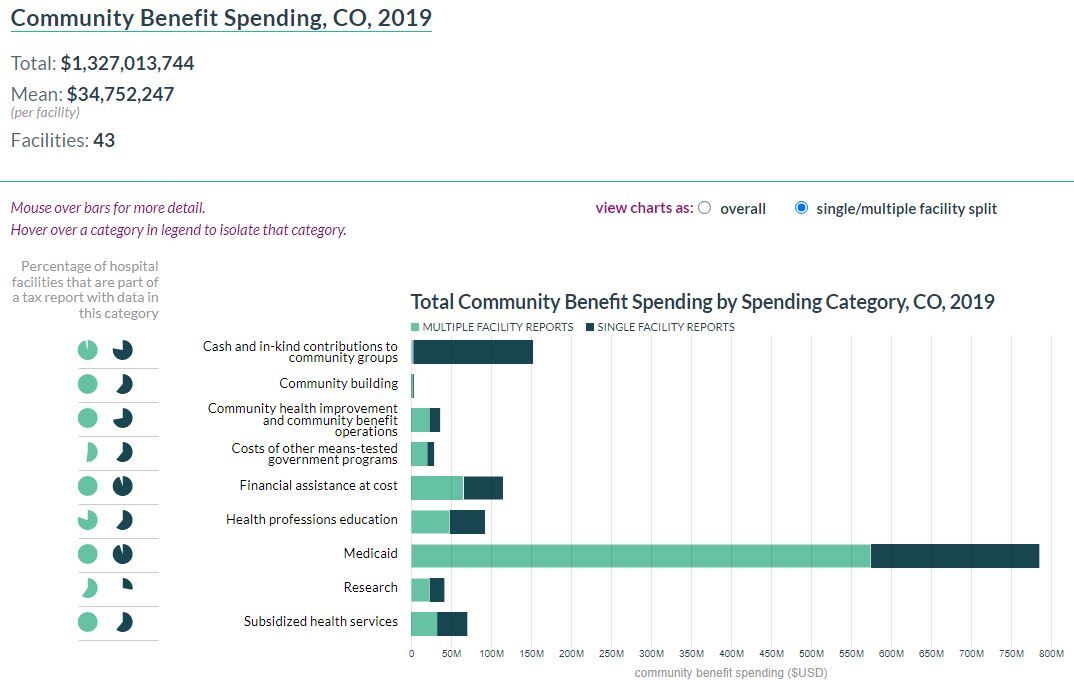
CBI also includes visualizations of community benefit spending at the state level. A user can select a state and year and can view the resulting charts as overall spending for the community benefit category or with a visible distinction between single- and multiple-facility tax reporting entities (Figure 4).
CBI Use
Promotion of CBI
RTI developed a communication plan in 2018 and has updated the plan annually to promote CBI’s availability. RWJF approves the communication plan, and RTI staff execute it. The purpose of the communication plan is to outline and guide promotional strategies for CBI. The goal of executing those strategies is to increase awareness of CBI and expand the number of community stakeholders who are using the CBI tool and dataset. RTI’s communication efforts fall into the following categories: Twitter, email outreach, partner outreach, and media outreach. Table 1 outlines the themes and overarching messages RTI employs across CBI’s communication channels and outreach materials.
The RTI-managed CBI Twitter account (https://twitter.com/BenefitInsight), launched in December 2017, loosely follows 60/30/10 guidance—60 percent of content seeks to engage, 30 percent is content others have posted, and 10 percent promotes the CBI tool itself. To conduct email outreach, RTI used Mailchimp to embed a newsletter sign-up feature (https://www.communitybenefitinsight.org/?page=info.newsletter) on the CBI site. RTI develops newsletters in Mailchimp, then emails them to subscribers quarterly. RTI also conducted partner outreach and established relationships with other relevant organizations with goals and audiences similar to those of CBI. RTI sends these organizations toolkits with pre-formed social media and newsletter content to facilitate the addition of CBI-focused messaging through partner organization communication channels. Finally, RTI identifies opportunities to engage in media relations activities. These activities include pitching stories through targeted communication to journalists at relevant online outlets and supporting the CBI users or partner organizations in developing press releases, blog posts, or op-eds to highlight CBI in local outlets.
Current Use of CBI
Since its launch, CBI has supported data collection and analysis for several publications comparing community benefit expenditure data across states (Palm et al., 2022); comparing community benefit spending across organizations (K. Chen et al., 2020); determining whether hospital, community, and state regulatory factors are associated with family income eligibility levels for free or discounted care (Mose, 2021); and examining community benefit expenditures around a specific social determinant of health (K. L. Chen et al., 2022). In addition, community benefit organizations have routinely used CBI to support data analysis at the state and local levels.
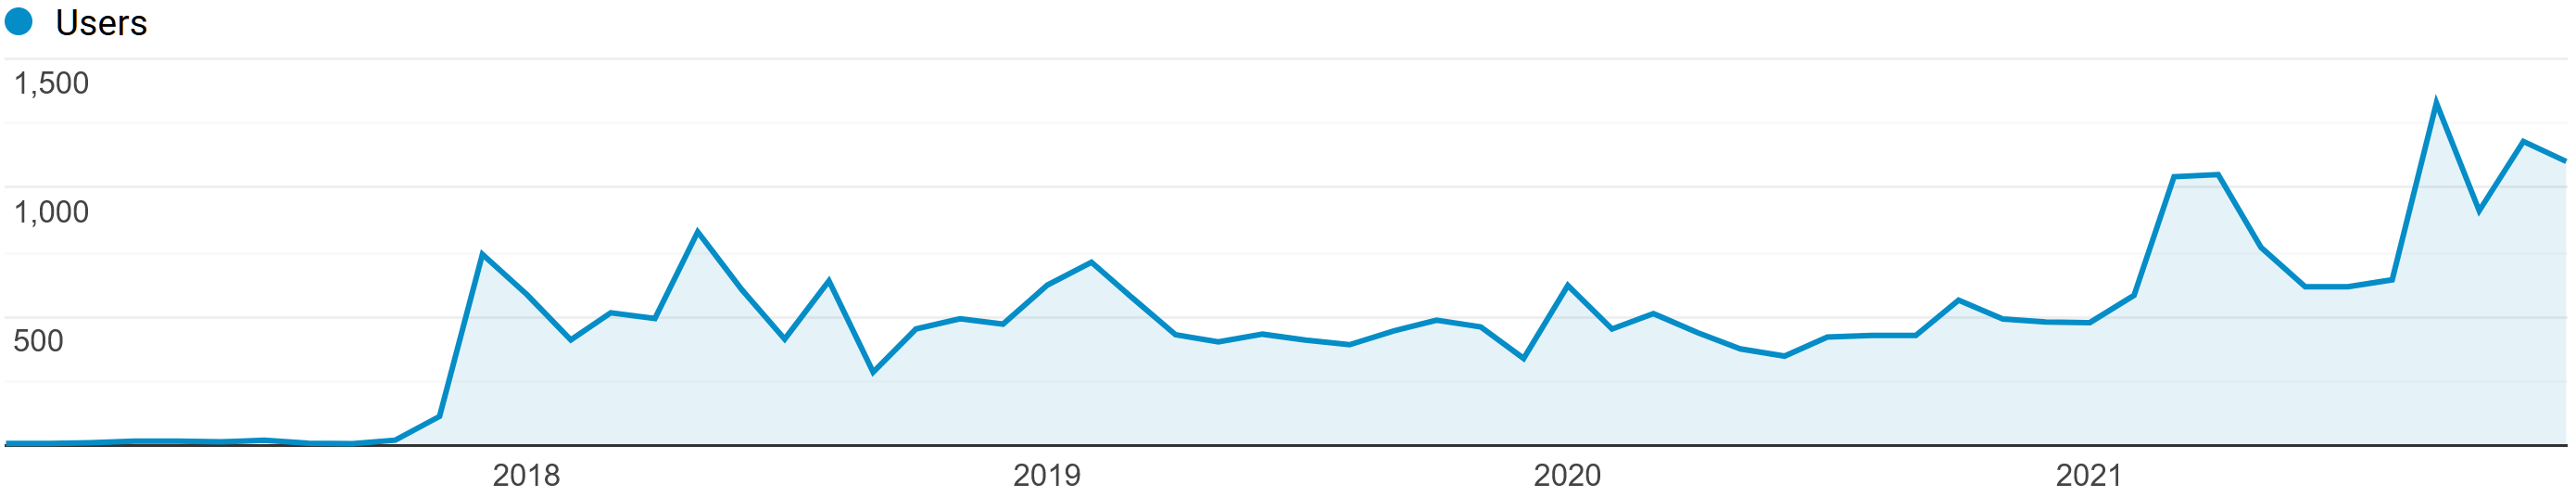
Since 2017, CBI’s user base has continued to grow. Figure 5 displays the monthly number of user visits to the CBI site, and Figure 6 displays the monthly number of user-run sessions. A user-run session is a single browsing session of one or multiple pages on the site to search CBI data. Because user data are aggregated through Google Analytics and CBI users are not required to create an account, it is not feasible to confirm whether current users align with CBI’s target audience (e.g., community stakeholders or hospitals/health care organizations).
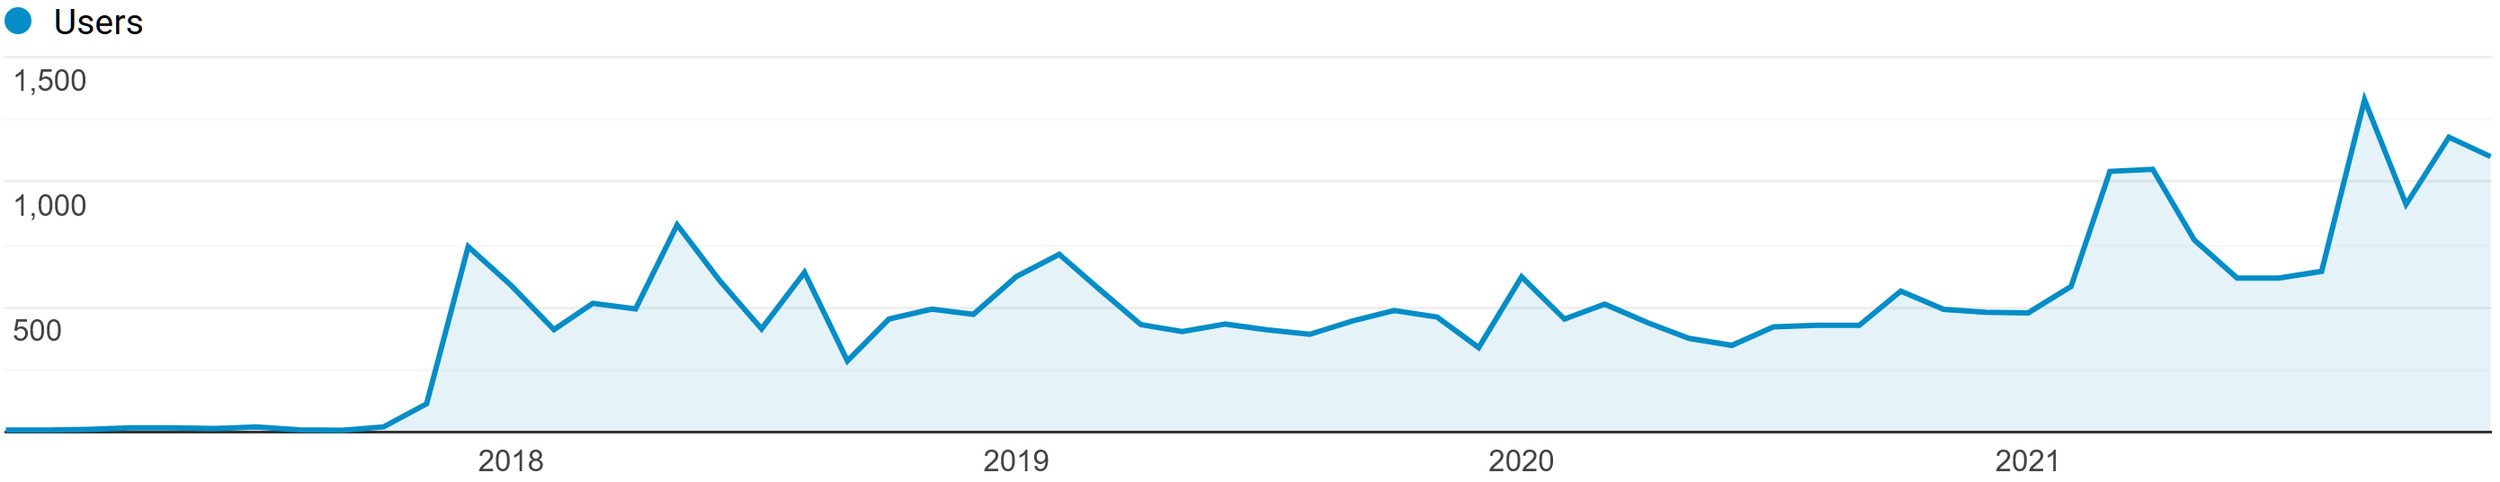
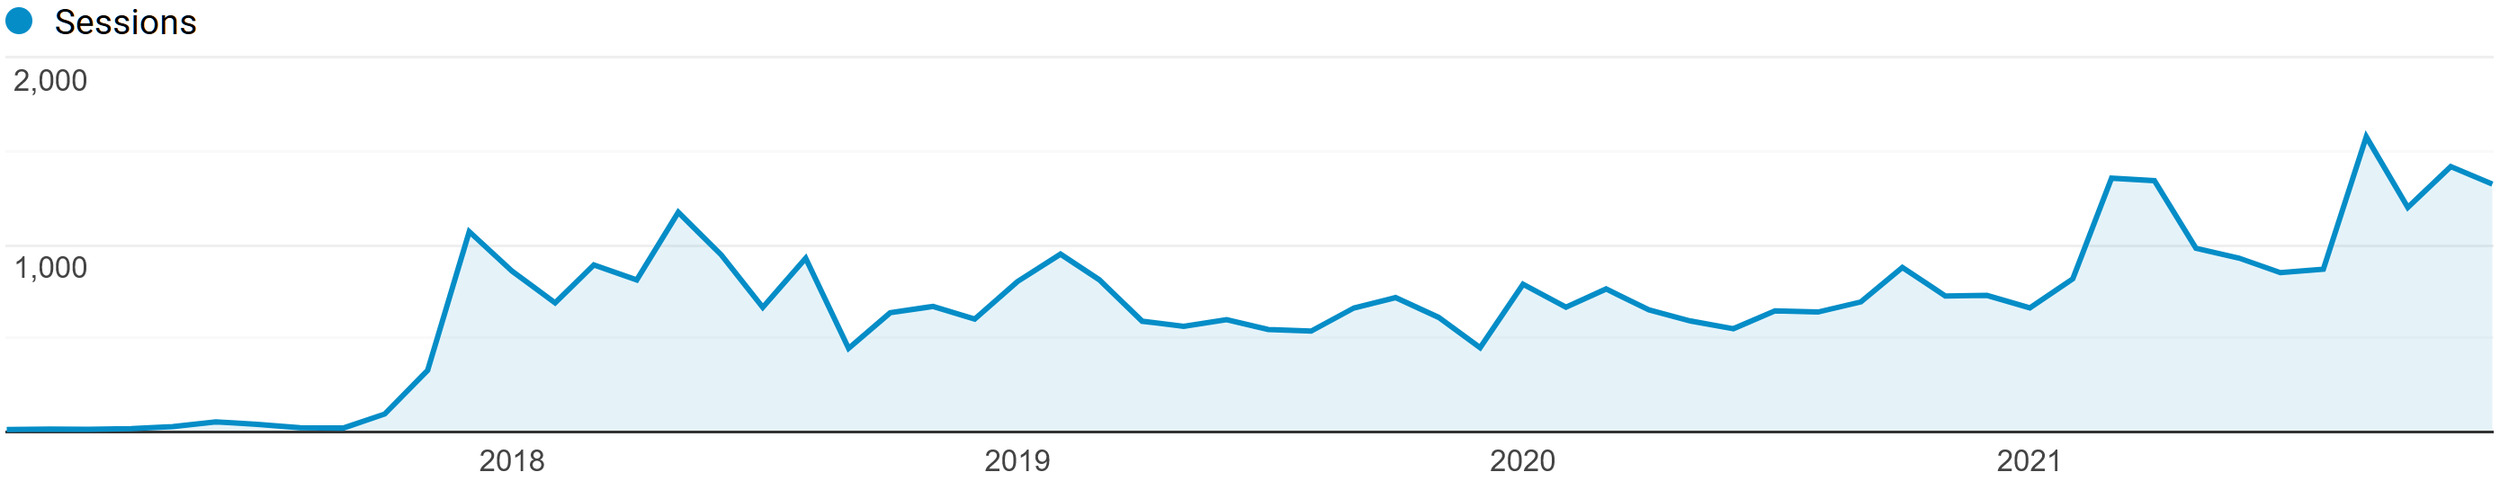
In 2021, CBI accrued visits from nearly 10,000 users, who ran more than 13,300 sessions. Of those users, 12.2 percent were returning, and 87.8 percent were new. Most users came from the United States, although just under 10 percent visited from India, followed by 1.8 percent from China and 1.6 percent from Ireland. There were fewer international visitors in prior years. In 2020, 3.65 percent of visitors were from India, 1.4 percent from Indonesia, and less than 1 percent from China. In 2019, 1.5 percent of visitors were from India, and only a handful (less than five visits) came from other countries. In 2018, 5 percent of visitors were from France, 2 percent were from Brazil, and 1 percent were from India. In 2017, 2 percent of visitors were from Brazil, and only a handful came from other countries.
Addressing User Questions
CBI users with technical questions or those who encounter bugs can (and have) contacted the CBI team through submitting a support request (https://www.communitybenefitinsight.org/?page=info.support). Each request is routed to multiple RTI staff members through a shared support-focused email address. RTI logs each support request received in a tracking document, and team members discuss each request to confirm who is responsible for addressing it. Examples of common support requests include data inquiries about unlisted hospitals (i.e., hospitals that are not nonprofit), downloading data, interpreting data, analyzing data, and clearing CBI data for use in publications. RTI also makes adjustments to the site as a result of these requests for information.
Evaluating CBI’s Utility
RTI has conducted two rounds of usability testing and process/outcome evaluations of the CBI tool, one in 2019-2020 and one that is currently ongoing. The purpose of the initial evaluation was to assess user engagement, overall satisfaction with CBI, recommendations for enhancing the tool, and to gather insights on the perceived value of CBI to the community. The current evaluation replicates these activities in addition to assessing CBI’s marketability and sustainability, including the potential to distribute CBI-related data and services for a fee. During each evaluation, the team conducted an online user survey, qualitative key stakeholder interviews, and reviewed requests for technical support or site enhancements. In the most-recent evaluation, key stakeholders also provided input through a focus group.
Given the limitations of aggregate data from Google Analytics in identifying types of CBI users, RTI relied on qualitative methods to characterize users and why they are accessing CBI data. Qualitative interviews were chosen as an appropriate data collection method because of their capacity for generating rich, detailed information on users and their information needs. Key stakeholder interviews provided a more-complete understanding of CBI users’ motivations, successes, and challenges with using the tool and recommendations for tool enhancements. Participants the 2019 evaluation (Table 2) were experienced CBI users chosen in collaboration with RWJF and the Center to Advance Community Health & Equity (CACHE) Center (a community improvement program operating through the Public Health Institute).
Some key findings from the 2019-2020 evaluation are as follows:
-
Overall, CBI users reported a positive experience with usability of the CBI tool, the quality of the CBI data, the visual appeal of CBI, and the ease of navigation (especially compared with raw Schedule H data). They also added that CBI provided helpful information about the different types of resources available to hospitals and community groups.
-
CBI users found the CBI data to be robust and reliable. The ability to access the data via an API is especially helpful for users and leads others to learn how to leverage the API for their own purposes.
-
Key stakeholder interviews provided some evidence that the primary groups to use CBI are researchers, data analysts, public health analysts and consultants, journalists, nonprofit consultants, and graduate students. The interviews and the survey revealed that CBI data are used for a variety of purposes, including research and project work, ongoing data acquisition and analysis activities, and information on job-related needs.
-
CBI data has been used by consultants, community organizations and health systems to compare their own spending with that of similar health systems over time to make spending more purposeful.
-
During the 4-month period after the implementation of API tracking (January 2020–April 2020), the CBI API received 50,180 page views.
“Hospitals are often invested in marketing themselves in a way that differentiates them from competitors, and one such area is in looking for ways to champion their spending. The CBI tool may be a useful resource in leveraging those efforts.”
— Key Stakeholder Interview, 2019
Using the first-year evaluation results, the team recommended future enhancements, maintenance, and development for the tool, which has since included the addition of new spending data into CBI as they become available.
The current evaluation period extends RTI’s work by reviewing and evaluating the CBI’s actual activities from October 2017 to May 2022. During this period, RTI added new spending data as it became available, continued to evaluate and improve the resource, increased marketing and communication efforts (e.g., social media), and made larger, customized portions of the CBI dataset available for a fee to help reduce future costs for sustainability. To assess CBI’s use, marketability, and sustainability, RTI identified users and non-users of CBI who are familiar with or have experience with community benefit spending/initiatives and individuals who are involved in data acquisition, data commercialization, or both within their respective organizations (Table 3).
Some preliminary findings from this feedback are as follows:
-
Researchers, students, and community benefit organizations continue to use CBI to support analysis.
-
CBI is described as a key factor in improving access to community spending data and an important tool for making connections between community benefit spending and areas of need. This is supported by the online survey data, which suggests that CBI can be used to further promote these connections through applications for grant funding and press releases.
-
RTI has established a basic social media presence on Twitter to promote CBI’s visibility and use of the dataset.
-
Engaging schools of public health and medicine is a key strategy for increasing awareness and sustainability of the CBI tool.
-
CBI users want improved access to some federal-level trends; more state-level data to make meaningful comparisons of community benefit spending; and the ability to obtain discrete, disaggregated data for making hospital-to-hospital comparisons. Disaggregated data are the result of combined reporting of Schedule H data of various hospitals within a health system.
-
Some key factors in sustaining CBI include engaging more stakeholders, considering cost and willingness to pay, establishing leadership buy-in (e.g., health system/hospital leadership and department heads of academic institutions), and supporting linkages with other existing datasets (e.g., American Hospital Association).
“I know that there’s a lot of people [in research] who are very interested in these data…anything that can help them connect in on how we’re informing social determinants of health and how we’re determining health care disparities that need to be addressed within those particular areas. Data sets that are rich on understanding that geographic variation, such a CBI, are so vital…”
— Key stakeholder interview, 2021
Discussion and Conclusion
Our aim with this paper was to describe how CBI was developed; how CBI prepared for and processed community benefit spending data; how CBI is used; how input on its use is gathered, processed, and prioritized; and how CBI can be expanded. As discussed previously, although IRS data are publicly available, they can be challenging to navigate, obtain, analyze, and comprehend (Massoglia, 2016). In 2018, more than $100 billion in community spending was reported to the IRS (American Hospital Association, 2021c). By making these data accessible and digestible, CBI promotes transparency to facilitate a dialog between nonprofit hospitals and the communities they serve.
Although this project has leveraged existing publicly available data, the tools and technologies developed to make these data more findable, accessible, interoperable, and reusable (FAIR) have their own intrinsic value. Researchers using these prepared CBI data agree that the effort required to set up and maintain CBI is of significant value to them and saves them time and effort accessing the data. Because this effort is a significant service to stakeholders involved with community benefit spending/initiatives, some transparency in the development process may also support other groups interested in launching similar efforts to make public use data more FAIR.
Although CBI strives to provide the most-recent IRS Schedule H (Form 990)-reported data, the effort is hindered by what the IRS makes available. The current time from the end of a tax-exempt hospital’s tax period to when the IRS makes its return publicly available is about 16 months (Internal Revenue Service, 2022b). Furthermore, hospitals are allowed a 5-month window (from the end of their tax year) to submit taxes and an optional 6-month extension to re-submit their returns (Internal Revenue Service, 2022b). Consequently, this results in a delay in the integration and delivery of data to CBI users.
Throughout 2022, RTI will continue to engage key stakeholders through qualitative interviews and collect responses to an online web survey of CBI users. In addition, the team will continue to gather input on identifying models to support the sustainability of CBI data once funding from RWJF concludes at the end of 2022. This includes continuation and refinement of the process that allows CBI users to purchase a license for access to specific sets of CBI data and examining the possibility of accessing CBI data via a subscription model. At this point, two university-based researchers have purchased a one-time license for access to tailored CBI datasets.
Additionally, the team routinely examines approaches to improving the overall look and feel of the site and the visualizations and has been investigating more-robust approaches to disaggregation of the aggregate reporting entities. RTI also has been pursuing enhancements to the offering by incorporating some national-level data, enhancing the state-level data, examining the potential to develop municipal-level data, and developing supplemental data analyses. As the enhancement of CBI continues, the improved availability and accessibility of community benefit data holds the potential to strengthen partnerships between nonprofit hospitals and community stakeholders.
Acknowledgments
RTI International would like to acknowledge the Milken Institute School of Public Health (George Washington University) and Northeastern University for their assistance in the initial development of CBI. RTI would like to thank Jamie Pina, PhD, for his early leadership and contributions to CBI. Furthermore, we would like to thank the Robert Wood Johnson Foundation for its support of and funding toward the development and continued maintenance of CBI.
RTI Press Associate Editor
Katherine Treiman