Introduction
Dietary assessments are often used to obtain nutrition profiles, monitor population trends in diet, and inform the development of food policies and programs. One particularly useful assessment method is the 24-hour dietary recall, which uses open-ended questions administered by a trained interviewer to obtain detailed intake data while circumventing issues of participant literacy (Shim et al., 2014).
Since 2002, the US Department of Agriculture’s Automated Multiple-Pass Method (USDA AMPM) (Moshfegh et al., 2008; Raper et al., 2004) has been the instrument used to collect 24-hour dietary recalls during the National Health and Nutrition Examination Survey (NHANES) (Ahluwalia et al., 2016; US Centers for Disease Control, National Center for Health Statistics, 2021). AMPM data are collected from NHANES’ 10,000 participants over a 2-year cycle and form the backbone of the USDA’s What We Eat in America (WWEIA), which tracks the nation’s nutrient intakes, identifies emerging types and sources of foods and beverages, and is used in establishing dietary standards and recommendations for the federal government (US Department of Agriculture, 2021b).
The AMPM interviews are conducted when participants visit NHANES mobile examination centers (MECs) to complete physical exams. A trained nutritionist administers the AMPM in a dedicated room and uses computer-assisted personal interviewing (CAPI) software and a large collection of three-dimensional (3D) models to assist participants with portion estimation (US Centers for Disease Control, National Center for Health Statistics, 2019). Although MECs are well-controlled environments, the National Center for Health Statistics (NCHS) has expressed interest in methods to address declines in response rates and increases in operational costs (Porter, 2019). One option is to transition AMPM administration to NHANES home interviews which occur before MEC appointments and consist of self-report questionnaires administered by field interviewers.
For large-scale studies and public surveillance programs, the home environment offers the potential of reduced cost and respondent burden, as well as increased efficiency of data collection and response rates (Williams & Brick, 2018). Recently, the Canadian Community Health Survey incorporated dietary recalls in participants’ homes. The survey was conducted in 2015 and included AMPM interviews among a representative sample of 20,487 individuals (Health Canada, 2017). For research studies that seek to examine dietary intake in smaller populations and for nutrition programs (e.g., Special Supplemental Nutrition Program for Women, Infants, and Children) that struggle with on-site participation of beneficiaries, home interviews can also mitigate competing demands and logistical barriers such as participants’ work schedules, lack of transportation, or need for childcare (George et al., 2014; Liu & Liu, 2016). However, successful home interviews for any of these purposes require carefully designed and tested protocols to ensure that quality measurement is maintained in a less-controlled setting.
The objective of this study was therefore to test the feasibility of conducting AMPM dietary recalls in the homes of study participants. This is a critical step before proposing a new approach to data collection, particularly for large-scale nutrition studies and programs that rely on data to determine services. The study was not hypothesis driven but designed to examine strategies for conducting dietary recalls in the home, obtain information on the situations encountered during such interviews, and generally determine the practicality of home administration.
Given these goals, the study, designed and executed before the widespread interruption of field surveys by the coronavirus pandemic, collected descriptive data on the home interviews and tested two variations from how AMPMs are usually conducted. The first variation was the type of interviewer and compared AMPMs administered by nutritionists to those administered by field interviewers (i.e., interviewer with no specialized knowledge in nutrition). The second variation was the equipment available to participants for portion estimation. Three types were tested: the 3D food models like those used at NHANES MECs, a two-dimensional (2D) food model booklet designed by the USDA, and an emerging technology in which food model images were rendered via augmented reality in a tablet.
Methods
Study Participants and Sampling
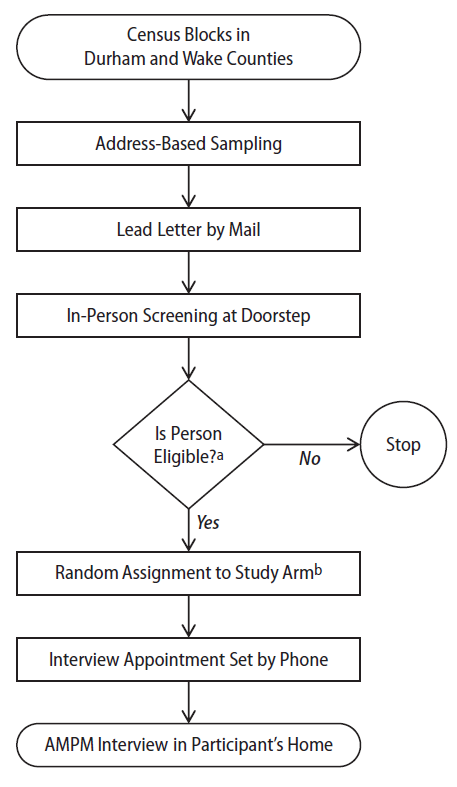
Participants interviewed in the study were community-dwelling adults living in Durham and Wake counties of North Carolina between November 2019 and February 2020. A two-stage sampling design was used. First, US Census block groups were purposively selected to provide variability of population density, race-ethnicity, and education. Second, using address-based sampling, we selected a random sample of residential addresses from the frame listing for each block group (Iannacchione, 2011). Although power analyses were not conducted for this feasibility study, we aimed for a total sample of 120 completed interviews across the study arms given budget, study period constraints, and an assumption that an overall response rate of 20 percent would likely be achieved among addresses selected.
Recruitment was also multi-staged. Lead letters were first mailed to the addresses introducing the study and requirements for participation. Next, field interviewers were deployed to screen potential participants at their doorsteps. Eligibility criteria included being an English-speaking adult age 18 years or older who lived at the selected address. Pregnant women and individuals who were fasting were excluded from participation. At the doorstep, staff collected the names, telephone numbers, and demographics of eligible adults interested in participating. Phone calls were made within 2 days to set appointments for in-person AMPM interviews. Up to two eligible adults could participate from the same address. However, in those instances, their dietary recall interviews were scheduled on different days to avoid the potential of reporting similar meals.
Before appointment setting, participants were randomly assigned one of six study arms that represented unique combinations of the type of interviewer that administered the AMPM (i.e., nutritionist or field interviewer) and the equipment used for portion estimation (i.e., 3D food models, booklet, or tablet; Table 1). During the last 3 weeks of data collection, we changed the assignment of some study arms due to interviewer/participant availability and feedback from interviewers on participants’ use of portion estimators.
Participants were interviewed in their home up to 1 week after their appointment was made. No interviews took place between November 27 and December 1 or between December 23 and January 3 to avoid reporting of atypical holiday meals. Signed informed consent was obtained, and participants were compensated $20 cash at the conclusion of their interview. RTI International’s Institutional Review Board approved the study protocol. Figure 1 illustrates each step in the sampling and recruitment process.

Interviewer Training
This study used a train-the-trainer model to train subject matter experts (SMEs) who subsequently trained interviewers on AMPM administration. In August 2019, the SME team was trained in-person on the USDA Dietary Intake Data System at the USDA Agricultural Research Service. Although some SMEs had previous experience with the AMPM, the training covered operation of the CAPI system as well as post-interview processing, coding, and nutrient analysis.
The field team consisted of five interviewers, including one nutritionist with a graduate degree in her discipline and another nutritionist with a graduate degree who was also a registered dietician. Both nutritionists had previously administered dietary recalls during their academic training and/or employment. Three field interviewers were also hired. They all had previous research experience either recruiting study participants or administering interviews, but none had knowledge of or experience with nutrition studies or dietary recalls.
All interviewers were trained together in October 2019. They first received a package of protocols in the mail for a week of self-study. Four didactic videoconferences were then held to present study goals, administrative and field procedures, and a detailed overview of the five AMPM steps. After these videoconferences, SMEs led a 2-day, in-person training at RTI headquarters in North Carolina that used the USDA’s AMPM computer-based training as well as role-play exercises. Role-play included menus of varying degrees of difficulty (e.g., fast food items, homemade recipes, salads, sandwiches, local cuisine) and incorporated portion estimators. As a follow-up to in-person training, up to two phone meetings were held with each interviewer for individualized AMPM practice. All interviewers were also given a 9-page take home exam that covered study methods and AMPM administration. Passing the exam led to “certification” of all interviewers by the SMEs. During data collection, three conference calls were also held to monitor progress and address field staff’s questions and concerns.
Interviewing Methods
All study participants were administered dietary recalls by interviewers using the USDA’s 2016 AMPM CAPI software on a password-protected laptop. The AMPM instrument uses multiple memory cues with standardized wording to elicit recall of all possible foods and beverages consumed over the past 24-hour period. Table 2 details the five steps of this method (Moshfegh et al., 2008).
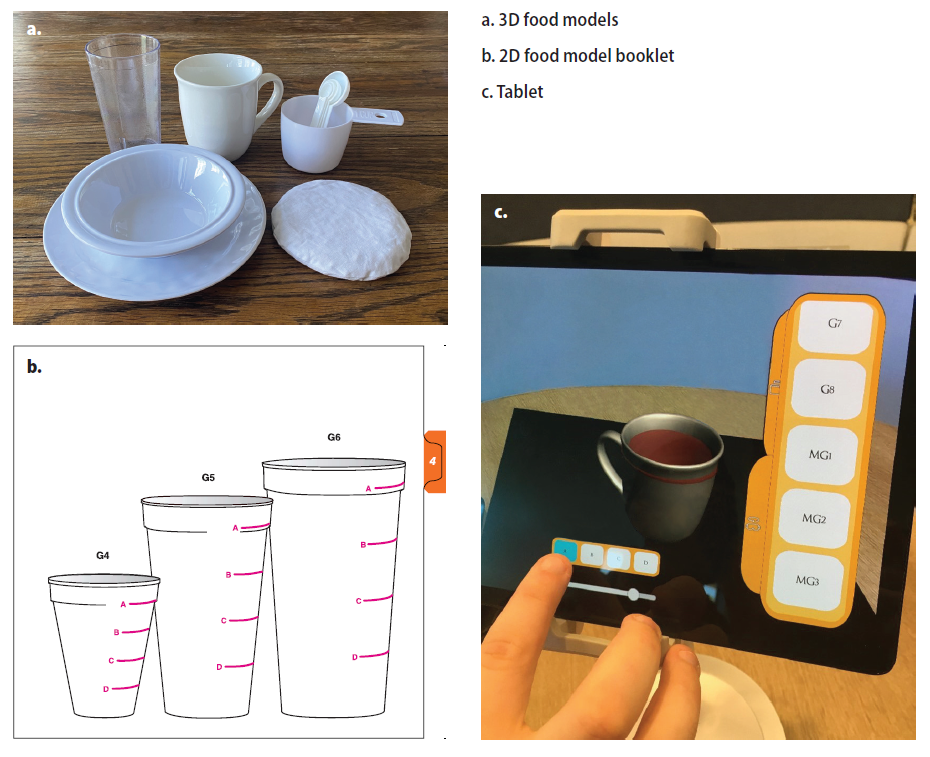
Participants could only use portion estimators of the arm randomly assigned to them. These consisted of 3D models that were either the same brand and model or like those used in the NHANES MEC (US Centers for Disease Control, National Center for Health Statistics, 2015), a USDA-produced Food Model Booklet (FMB) containing life-size drawings of the models (McBride, 2001), or a tablet with images of the models (Figure 2). The booklet, used during follow-up dietary recalls by telephone in NHANES, was also the portion estimator of choice during home administration of the AMPM for the 2015 Canadian Community Health Survey (Health Canada, 2017). The tablet was a new tool developed by RTI that used augmented reality technology (AR). Gaining popularity across many disciplines, AR renders images so they appear on a device as life-size and in the viewer’s real-world environment (Daiwat & Dvijesh, 2017). The AR food models on the tablet were accessed by participants using a scrollable menu organized and labeled similarly to the USDA’s FMB. Each image could be rotated by touch and, when applicable, had varying levels of fill through a touchscreen. Participants could rotate the items as well as view and select the level of fill for items such as mugs and glasses. At the end of the interview, participants were asked to complete a short feedback form in private (i.e., while the interviewer packed up materials). At this time or shortly afterwards, interviewers also completed a short feedback form.

Data Processing
AMPM data were processed using the USDA Food Surveys Research Group’s Dietary Intake Data System (FSRG DIDS). This system was developed to increase the quality and efficiency of food intake surveys and has been use for NHANES since 2002 (Raper et al., 2004). First, the DIDS’s Post Interview Processing System (PIPS), Version 2.2 was used to reformat AMPM data and assign food codes according to the 2015–2016 Food and Nutrient Database for Dietary Studies (FNDDS). In this step, 51 percent of the data were successfully converted into gram amounts and assigned nutrient values. The USDA FSRG then conducted final coding using the DIDS’s SurveyNet software, Version 2.2. In this step, FSRG coders used the FNDDS to manually code the remaining 49 percent of entries. The USDA FSRG also performed quality-control checks for inconsistent times and occasions, inaccurate combination codes, excessive amounts, and invalid responses. The percentage of auto-coding and the data quality were consistent with those typically observed in NHANES data (e.g., 50 percent of data were auto-coded for NHANES cycle 2015–2016 and 56 percent for NHANES cycle 2017–2018; USDA FSRG data, previously unpublished).
The main measures used to evaluate feasibility of home administration were obtained from paradata, which are typically the administrative data collected during a project for the purposes of monitoring project progress (Safir et al., 2001). Our paradata came from the case management system and the interviewer and participant feedback forms. The case management system provided data on date of administration and AMPM timing. The interviewer feedback form provided qualitative data on where the interview physically took place and whether participants used any items in the home to facilitate recall. The participant feedback form provided Likert scale data on satisfaction with the overall experience and with the materials used.
Statistical Analyses
Final dispositions of cases and outcome rates were assigned and computed according to the 9th edition of the Standard Definitions Report from the American Association for Public Opinion Research (AAPOR) (American Association for Public Opinion Research, 2016). We chose formulas for outcome rates that included a calculation of the estimated proportion of cases of unknown eligibility that were eligible (Smith, 2009).
Statistical analyses on paradata and AMPM data were completed with SAS, Version 9.4. Comparisons were made to identify statistically significant differences at α level of 0.05 by source of variation separately and then across the six study arms when applicable. Chi-square and Fisher’s exact tests were performed to identify differences in demographics or interview characteristics. Potential changes in length of interview were examined using autoregressive error models (i.e., PROC AUTOREG) to correct for autocorrelation in time series data. Models included subsets of cases by source of variation and examined whether length of interview changed significantly over the study period.
AMPM nutrient outcomes were stratified by gender and were first compared with the USDA’s WWEIA data tables (US Department of Agriculture, 2021b). Food group intakes (e.g., fruit, vegetable, dairy, protein foods) were compared with the agency’s Food Patterns Equivalents Database tables (US Department of Agriculture, 2021a) to determine whether values were plausible and consistent with national data collected with the 2016 AMPM instrument. Two-way ANOVA was performed to test for statistically significant differences in AMPM outcomes across study arms.
Results
Sample Characteristics
The study’s case management system contained 624 uploaded addresses. During in-person screening for eligibility, 37 addresses were determined to be vacant or nonresidential, 142 individuals refused to be screened, and 68 individuals did not speak or understand English well enough for a screening to occur. Field staff succeeded in screening 377 individuals; all but 2 were determined to be eligible for the study. Of these individuals, 161 were reached by phone to make appointments for AMPM interviews; 133 subsequently completed an AMPM interview at home. The remaining 28 did not complete AMPMs either because of refusal, language barrier, or physical/mental limitation determined when the interviewer arrived at the home to conduct the AMPM interview. Using AAPOR standard definitions and calculations, we determined that the estimated proportion of cases of unknown eligibility that were eligible was 77.8 percent, and that the study had a contact rate of 33 percent, refusal rate of 5.1 percent, cooperation rate of 84.2 percent, and response rate of 27.4 percent. The final sample of 133 participants included 55 men and 78 women (41.4 percent and 58.6 percent, respectively). The sample was mostly middle-aged, non-Hispanic black, urban, with at least a high school diploma (Table 3). No statistically significant differences were observed in age, race-ethnicity, education, or neighborhood density when men and women were compared, and no significant differences were observed in demographics across the six study arms.
Interview Characteristics
A third of interviews (n = 45; 33.8 percent) were administered by nutritionists and 66.2 percent (n = 88) were administered by field interviewers. Most interviews were assigned the FMB as equipment (n = 54, 40.6 percent), followed by 3D food models (n = 44, 33.1 percent), and the tablet (n = 35, 26.3 percent). Purposive reassignment of 15 percent of participants’ study arms to field interviewers with either 3D food models or FMB occurred during the last three weeks of data collection because of challenges with schedules, as well as personal accounts from field team conference calls and feedback forms that the AR tablet could be fragile or sensitive to suboptimal conditions (i.e., lack of flat surface). This switch yielded more interviews administered by field interviewers with the FMB (n = 37, 27.8 percent) and the 3D food models (n = 30, 22.6 percent). The distribution of AMPM interviews across all six study arms is displayed in Table 3.
Table 4 displays the characteristics of the AMPM interviews and includes differences across study arms. Most interviews occurred during weekdays and in the afternoon though field interviewers were more likely to schedule interviews on weekends or in the evenings compared with nutritionists. The most common location where interviews took place was the living room or den (52.0 percent) followed by the kitchen (22.0 percent) and dining room (16.3 percent). Interviewers reported that a table was available for laptop and material set up in 70.7 percent of cases and that they were interrupted during the interview in 29.3 percent of cases. Statistically significant differences were observed across study arms for location of interview and table availability though the differences were not consistent by type of interviewer or equipment used.
Because the interviews occurred in homes, participants had access to items in their kitchen to assist with recalls. While interviewers did not recommend or encourage participants to refer to kitchen items, participants referred to them in 44.7 percent of interviews. Examples of items that participants selected from their homes to recall food or beverages consumed included products such as juice drink mix, deli meat, sour cream, tomato paste, creamer, ice cream, popsicles, trail mix, and candy. Often these items were accessed to help report the brand, type, or flavor of the product. Examples of items that participants selected to help recall portion size included drinkware (e.g., cup, mug), water bottle, frozen meal, turkey sandwich, leftovers (e.g., fried chicken), can of evaporated milk, and salt. Interviews with nutritionists using the booklet and tablet had more references to kitchen items compared with other study arms at α level of 0.05.
Overwhelmingly, participants were extremely or very satisfied with the materials and rated the overall experience as excellent or very good. No significant differences were observed in participant feedback across study arms, although the most variation in ratings occurred for interviews administered by field interviewers with the tablet (Table 4).
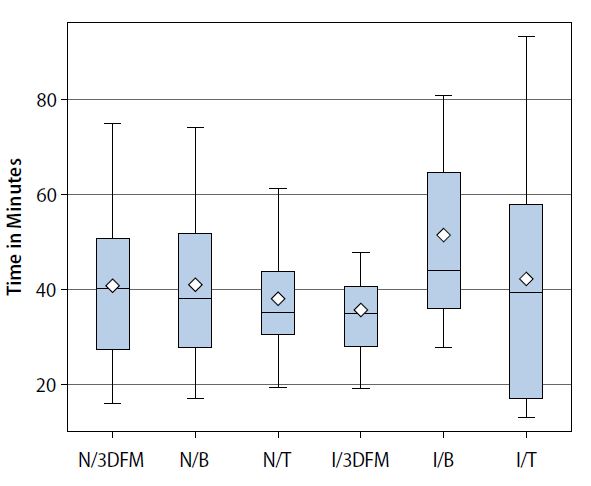
Length of interview was examined using paradata from RTI’s case management system and the AMPM system. Two interviews administered by nutritionists were removed from analyses due to being outliers with values more than 5 times the mean. The average length of the interview was 41 minutes, ranging from 13 to 93 minutes. Figure 3 displays the distribution of length of interview for each study arm. No statistically significant differences were observed in length of interview by interviewer type (F = 0.48; df = 1; P = 0.489) or equipment type (F = 1.14; df = 2; P = 0.324), nor was there a difference across the study arms (F = 1.46; df = 5; P = 0.208; Figure 3). Length of each of the five AMPM steps was also examined. The detail and review step took longest to complete (mean = 26 minutes; range = 7 to 63), while final probe was shortest (mean = 2 minutes; range = 0 to 10). No differences were observed in the length of time it took to complete any AMPM step by interviewer type, equipment type, or study arm (data not shown).
.jpeg)
Table 5 displays the results of time-series analyses on length of interview over the study period. Length of interview was observed to decline significantly from November to February among interviews conducted by nutritionists, but not field interviewers. No significant change was observed in length of interview over the study period for any of the three types of equipment. We ran additional models to detect whether the length of any of the five AMPM steps significantly reduced over time. Among a subset of field interviews using the FMB, length of interview was observed to declined slightly over the study period and was the result of a decrease in the time it took to complete the detail and review cycle (P < 0.01; data not shown).
AMPM Outcomes
Table 6 presents AMPM data after SurveyNet PIPS processing, auto-coding, and manual coding. The number of food items consumed, food group intake, and nutrient intake are displayed for men and women separately. Compared with the USDA’s WWEIA and FPED data, all values were within anticipated ranges except for one case with low energy intake (i.e., 473 kcal for a man in the N/T study arm). It was determined that although this value was unusual, it was conceivable and therefore kept in analyses.
Men and women averaged the same number of food items (16.5 for both; range = 6–33 for men, 4–34 for women). The intakes of fruit, vegetable, dairy, and protein foods did not vary significantly across study arms for either gender. Average energy intake was 3,011 kcal (range = 473–7,092) for men and 2,105 kcal for women (range = 952–7,633). Among men, significant differences were observed by study arm for energy intake, carbohydrates, and fat owing to the unusual case in the N/T study arm. No differences were observed in nutrients across study arms for women.
Discussion
This study found that it is feasible to conduct dietary recall interviews using the USDA’s AMPM in participants’ homes. We met our objectives to determine whether home administration is practical and obtained information on what type of situations were generally encountered during home administration. The study team successfully executed a train-the-trainer framework that resulted in effective trainings on AMPM administration for field interviewers as well as nutritionists. Testing of two sources of variation in the home, interviewer type and equipment for portion estimation, showed no statistically significant differences across most measures. This indicates researchers’ choice of study design can focus more on availability of staff, cost, interviewing skills, and ease of transport of materials as opposed to location of survey administration.
The data show overwhelmingly there is little difference between information elicited from field interviewers compared to that elicited from nutritionists. Despite having no expertise in nutrition or experience with USDA’s specialized multiple-pass CAPI system, the field interviewers in this study were able to administer the AMPM and obtain data similar to those of nutritionists. More so, quality-control review by the USDA FSRG demonstrated that inputs and the percentage of auto-codes were akin to those from past NHANES AMPMs in the MEC.
The successful training of and involvement of field interviewers in this study met our main objective related to feasibility of AMPMs in the home for large-scale studies. On one hand, nutritionists are SMEs and have dietary recall practice and experience through their education and employment. However, they can be impractical interviewers for home-based data collection in large studies given their labor rate as specialists with advanced degrees. Also, they potentially lack experience in administering additional survey components as would be the case for NHANES home interviews. On the other hand, field interviewers are pragmatic staffing choices and are the standard employee group used to conduct large studies. Importantly, field interviewers often choose field research as their main source of employment and begin studies with prior experience. In their training and experience, field interviewers develop a unique set of skills related to establishing rapport, gaining cooperation, and converting refusals that other staff do not have. Finally, in our experience, field interviewers were available for work at times when participants were more likely to be home (i.e., weekends, evenings), whereas nutritionists had other obligations in their field that hindered their availability for field work at these times.
Our study showed that dietary recalls at home offer a unique advantage for portion estimation, in that some participants will reference items such as drinkware, plates, or groceries from their cabinets, pantry, or refrigerator to help them recall the type, brand, or amount of an item they consumed the day before. We observed more references to home items when participants were interviewed by nutritionists, but given the data we collected, we cannot ascertain whether nutritionists were probing more than field interviewers. To understand more fully the effect of referencing items, additional research could include comparing AMPM results when participants are permitted, even encouraged to do so, to when they are not.
With regards to the equipment brought into the home for portion estimation, there was little difference observed in AMPM data collected using the 3D food models, booklet, or tablet. Although 3D food models are used for NHANES and have the advantage of being able to be touched and held, transporting them can be a burden for interviewers. Our study used a 19-inch backpack with a handle and wheels for storing and transporting the items, but all interviewers felt there were too many objects to set up and then put away at completion. Anecdotally, the consensus from interviewers was that the USDA food model booklet was easiest to transport and most preferred. Despite the estimators being 2D images, participants could flip through the booklet easily and supplement it with items from the home. Our findings, along with the fact that the booklet is used during the NHANES follow-up telephone call to adjust for within-person variation and during the 2015 Canadian Community Health Survey home administration, should give researchers confidence that this “low-tech” tool makes the most sense for use with the general population.
The AR tablet, on the other hand, offered an innovative method for examining life-size objects in a digital format. Although the touchscreen scrolling menu replicated the organization of the USDA booklet, interviewers shared concern that the tablet was a delicate instrument and could be prone to breakage. We also believe that AR technology needs to advance before large-scale use because of occasional “noise” observed during this study (i.e., freezing and/or shaking images, loss of image from marker area). Future technological advances may produce an integrated AMPM CAPI system with AR images, but at the present time, using a laptop and tablet together seems to be unnecessarily complicated, particularly when engaging with adults who may not be accustomed to tablet use or AR.
This feasibility study sample was drawn from English-speaking adults living in two counties in central North Carolina. Interviewers had to exclude some potential participants during screening because of language difficulties. Regional demographics, culture, and language therefore prevent direct comparison to NHANES MEC administration as well as to national intake data publicly shared through WWEIA. However, the USDA FSRG determined that most measures from this study were plausible and within reasonably expected limits for both men and women.
We did compare length of time to administer AMPM interviews to national studies and found that our home interviews averaged 41 minutes compared with estimates of 30 minutes in Canada’s Community Health Study and 20 minutes in the NHANES MEC, as described in their reference guide and procedure manual, respectively (Health Canada, 2017; US Centers for Disease Control, National Center for Health Statistics, 2019). Longer administration time was expected as our training did not emphasize speed but focused on accuracy in AMPM administration because field interviewers had never conducted dietary interviews or used the software before. Also, the MEC is designed to move through modules quickly with 10 to 12 participants completing various exams at a time and a private room already set-up exclusively for dietary interviews. Conversely, our field staff needed time to establish friendly rapport, choose a location within the home, and adjust the set-up as needed. Opportunities for participants to obtain items to facilitate recall, as well as interruptions by others in the home likely influenced interview time as well.
Still, evidence from the AMPMs administered by nutritionists shows interview time can decrease with practice. Therefore, it is premature to assume that AMPM interviews in the home are too burdensome and/or less feasible than in a clinical setting. For NHANES specifically, we assume length of AMPM interview would be less than what we observed once integrated into previously established home data collection protocols. More research, with a larger sample and longer data collection period, is likely needed to determine how length of time is influenced by the interview experience (e.g., precisely how many/when do references to items and/or interruptions occur during home AMPM administration) and whether time requirements similar to those of the MEC could be attained when the AMPM is integrated into NHANES household data collection.
One of the most optimistic findings from this study is that the range of values reported for number of food items, food group intakes, and nutrient intakes for AMPMs in the home were observed to be reasonable across all study arms regardless of interviewer or equipment type. Importantly, it is also noted—with caution due to lack of true comparability—that energy intake was observed to be approximately 200 calories more than what is typically reported in WWEIA. It has been demonstrated with NHANES data that underreporting of energy intake can occur (Archer et al., 2013; Briefel et al., 1997). However, whether the larger values observed in this feasibility study are more accurate because of increased time spent by interviewers with participants, increased comfort of being at home for participants, or the participants’ ability to reference their own items from the home for portion estimation is undeterminable. The difference could also be the result of regional diet or another unknown confounder.
The strengths of this feasibility study include it being the first, to our knowledge, to assess AMPM feasibility in the home with field interviewers. Findings can be viewed in the context of NCHS’s Health Measures at Home study (Gindi et al., 2014), designed to assess differences between the collection of physical measurements and biospecimens in the home and a clinical setting. In the study, Gindi and colleagues found that it is feasible to move anthropometric measurements from the NHANES MEC to homes as no significant differences were observed in height or weight obtained by MEC health technicians or home examiners. Other strengths included our study’s vigorous training of interviewers using the USDA-designed curriculum as well as RTI-designed role play exercises; hiring experienced field interviewers, which would likely be a prerequisite for large-scale studies; and the collection of paradata that allowed assessment of feasibility.
The study faced a few challenges. As with NCHS’s Health Measures at Home study, suboptimal conditions were observed in some homes (i.e., distractions and lack of table in about one-third of homes) (Gindi et al., 2014). In our study, these issues were allayed by experienced interviewers, and AMPM interviews still produced plausible and reasonable data. Other study limitations included a small sample size, which affected power for statistical tests, although this was mitigated by using, for example, Fisher’s test in place of chi-square. The sample was also limited in geographic area and therefore not generalizable to the national population.
Future research is needed to address some issues that were out of scope for this study. As this was a feasibility study, only one type of interviewer and one equipment type were assigned per participant. More robust study designs could have each participant complete dietary recall interviews with both interviewer types and multiple equipment. Data collection could also add location as a third source of variation with the home setting being compared with interviews in a clinical setting comparable to that of the NHANES MEC. With more elements added to the study design, response rates can become important paradata. Although there are repeated measure challenges, randomization and ample time between scheduled appointments may help address this.
Importantly, this study was conducted just before emergence of the COVID-19 pandemic in the United States. Initial concerns regarding transmission forced the suspension of field operations for several national studies, but some studies have resumed data collection with updated protocols. With proper PPE, washing hands, social distancing, and outside areas to conduct interviews, AMPMs at home can be conducted safely. However, other modes of administration, such as phone interviews, warrant inclusion in future studies to test the feasibility of AMPM dietary recalls without initial in-person interaction between interviewers and participants. Although NHANES does include a follow-up AMPM by telephone, a new study would test whether phone AMPMs are feasible without participants ever using the materials or having interacted with an AMPM interviewer before. Videoconferencing may also be a mode worth exploring, although challenges with connectivity may bias samples toward younger participants or those with higher socioeconomic status.
This study demonstrates that dietary recall data can be collected by field interviewers in a home environment using equipment that is easily portable. With vigorous training and support for field staff, this study produced paradata that supported feasibility as well as reasonable AMPM intake data. Although home environments can be challenging for data collection, several characteristics are beneficial for dietary recall. Research and/or program objectives should be carefully considered along with available resources when designing plans for home data collection.
Acknowledgments
The authors thank the following colleagues for their contributions on this project: Lilia Fillipenko, Joseph McMichael, and Yhung Mlo for sampling, case management, and/or data processing; Shena Jordan, Sally Kohls, Anne-Lyne McCalla, Paula Perez, and Isioma Robinson for field work; Mary Muth and Paul Pulliam for their helpful advice on analyses and findings; and RTI’s Lab 58 for tablet development.
The research was supported by RTI International’s intramural funding program and received no specific grant from any funding agency or commercial sector.