
Introduction
Mail and web-based questionnaires are widely used for data collection and offer a financially viable option when collecting information from large, geographically dispersed populations (Jones et al., 2013; Millar et al., 2019; Radack et al., 2023; Sammut et al., 2021). A variety of strategies can improve mail and web-based survey response rates, including an attractive format for the questionnaire, financial incentives, and different procedures/modes for delivering the questionnaire to the target population (Jia et al., 2021; Sammut et al., 2021; Short et al., 2015). Other strategies to improve response rates include in-person survey administration, minimizing survey language complexity, personalization of messaging, and prenotification of survey administration (i.e., advance notice) (Anhang Price et al., 2022; McBride et al., 2021).
A systematic literature review (including studies dated between 1995 and 2020) of strategies to enhance response rates of patient experience surveys showed that administering patient surveys in sequential mixed modes is the most effective strategy for achieving high response rates (response rates defined as “high” may vary by target population) (Anhang Price et al., 2022). The most common mode of survey administration is by postal mail with telephone follow-up (Anhang Price et al., 2022). Adding a web mode can increase the response rates an additional 2-5% (Anhang Price et al., 2022). Many studies have evaluated the impact of tailored survey materials and related strategies to enhance response rates (Anhang Price et al., 2022; Sammut et al., 2021; So et al., 2018; Svensson et al., 2012). However, there is a gap in the literature regarding the use of non-white envelopes or seasonally tailored postcard reminders to improve response rates for web-based surveys. This study was not randomized, powered, or otherwise designed to test the casual impact of envelope color or postcard design; however, the natural experiment setup of the cohorts and timing of this study allows for some possible observations.
Methods
Study Population
This analysis used data collected from a study about mammography screening patterns of Black and White breast cancer survivors to assess racial differences in relationships between breast cancer stage at diagnosis and factors related to screening history and method of cancer detection. The RTI International Institutional Review Board (IRB) reviewed and approved the study (MOD00001469). We used statewide cancer registry data from California, North Carolina, and Texas to identify eligible participants who were female, aged 45 to 64 years old at time of breast cancer diagnosis; Black or White race; English speaking; had an initial diagnosis of breast cancer between 2016 and 2021; were not diagnosed with other types of cancer since the breast cancer diagnosis [except non-melanoma skin cancer]; and were alive at time of data collection. Each participating cancer registry provided mailing information for a sample of 1,000 or more female breast cancer survivors who met our inclusion criteria, and over half of the sample were Black women.
Survey Deployment
The goal of the present analysis was to assess whether use of a colorful tie-dye mailing envelope and seasonally tailored postcard reminders with a catchy phrase related to both the season and completing the survey would increase the response rate over the use of plain white envelopes across the study cohorts. Three communication prompts were implemented for study recruitment: (1) initial survey invitation in an envelope with link and QR code to web-based survey; (2) postcard reminder with link and QR code to web-based survey; and (3) the option of a paper copy of the survey (which included a prepaid business reply envelope), upon request. The initial survey invitation and post card reminder both included information about requesting a paper copy of the survey. The survey took approximately 20 minutes to complete, and participants received a $30 incentive for a completed survey, which is comparable to incentives for similar surveys. The survey was deployed in eight cohorts based on when we received participant contact information from state cancer registries.
Survey Recruitment Materials
For initial survey invitations, standard recruitment materials included a white envelope. The enhanced recruitment materials included a colorful, tie-dye envelope. Cohorts 1 and 2 received standard recruitment materials. Cohort 3 examined the impact of different envelopes on response rates, and prospective participants received either standard or enhanced recruitment material. Cohorts 4 through 7 received the enhanced, tie-dye envelope. For Cohorts 1 through 7, all non-respondents to the initial mailing received a seasonal postcard reminder as follow-up. To increase the number of Black respondents in the overall sample, Cohort 8 received (an additional sample of 1000 eligible black women) an invitational contact using a seasonally based postcard. Individuals in Cohorts 2 and 6 were contacted three times due to a second invitation that preceded the postcard reminder. The second follow-up invitation was sent due to formatting errors in the initial survey invitation. The initial survey invitation and postcard reminder recruitment materials used for each cohort are outlined in Table 1. The envelope color and postcard themes were based on convenience and cost.
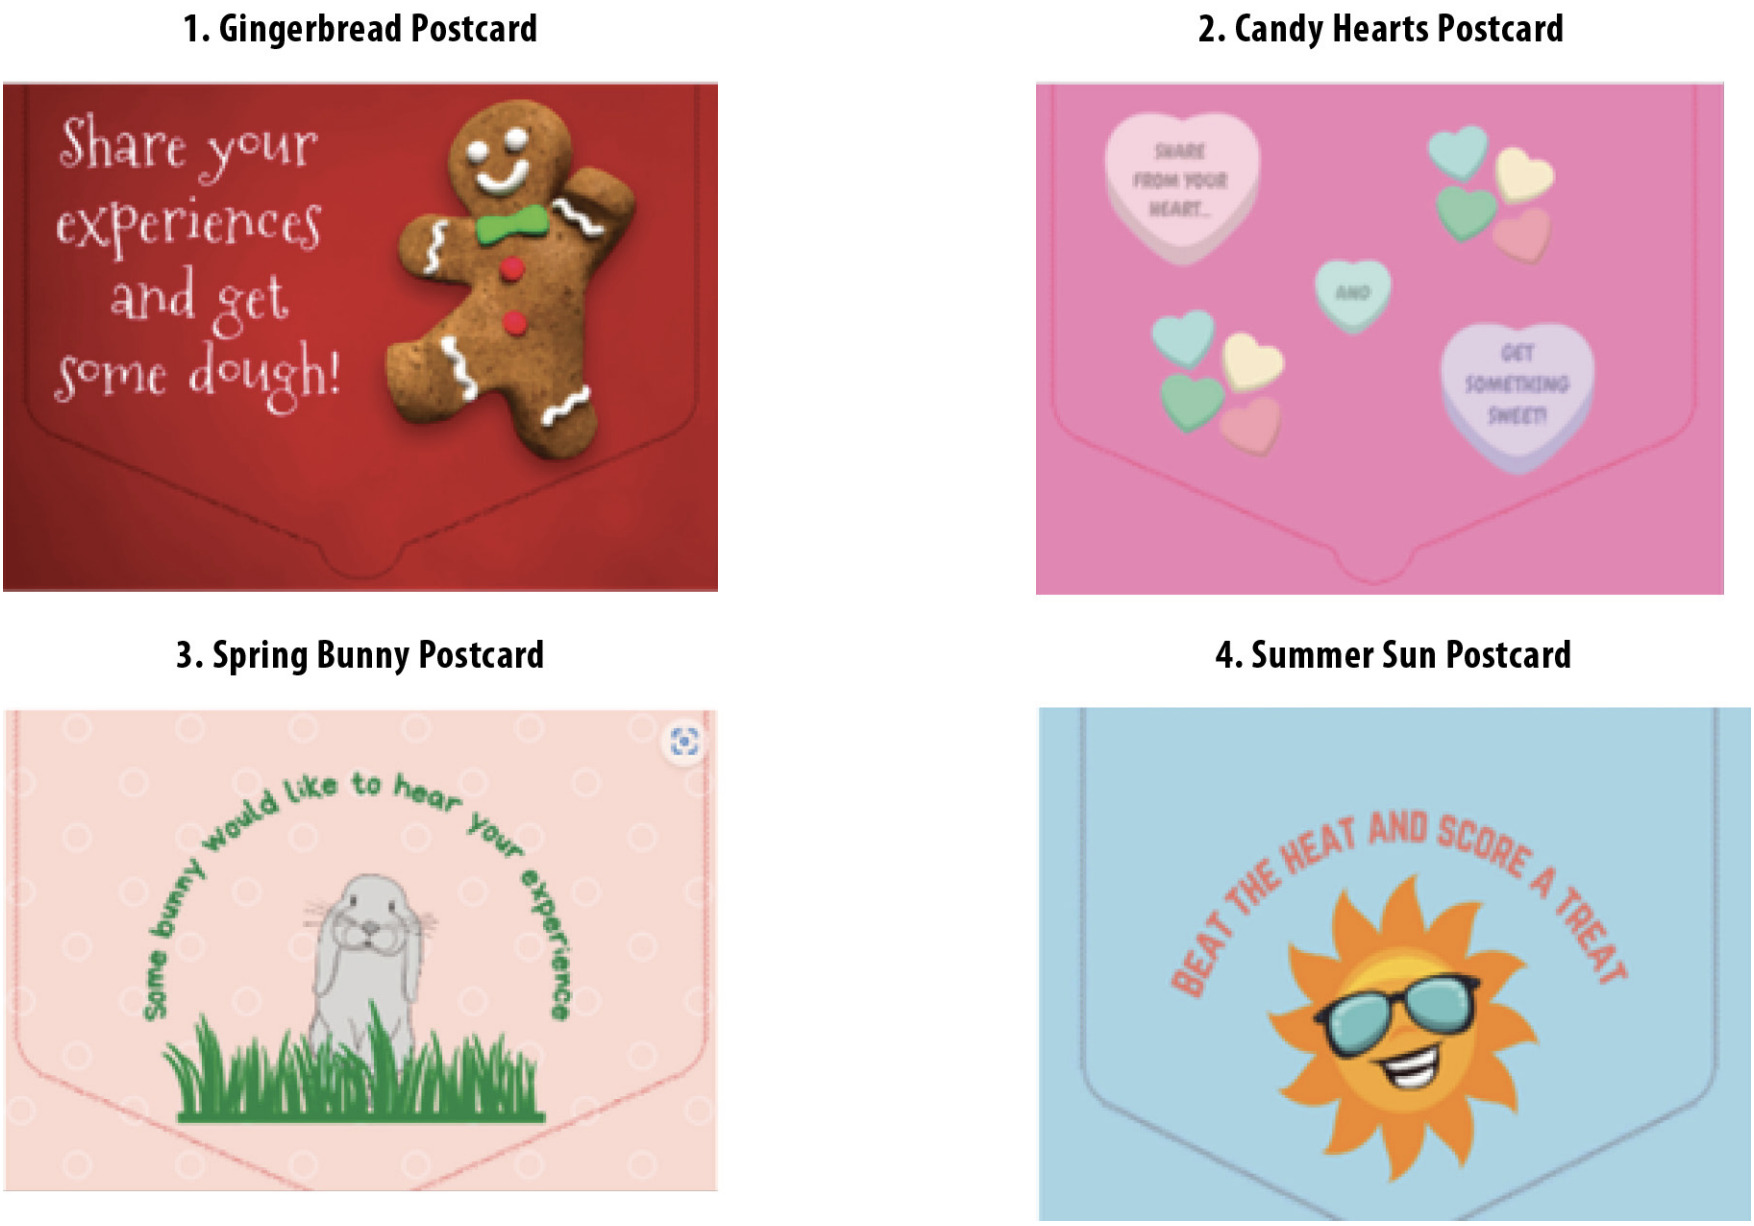
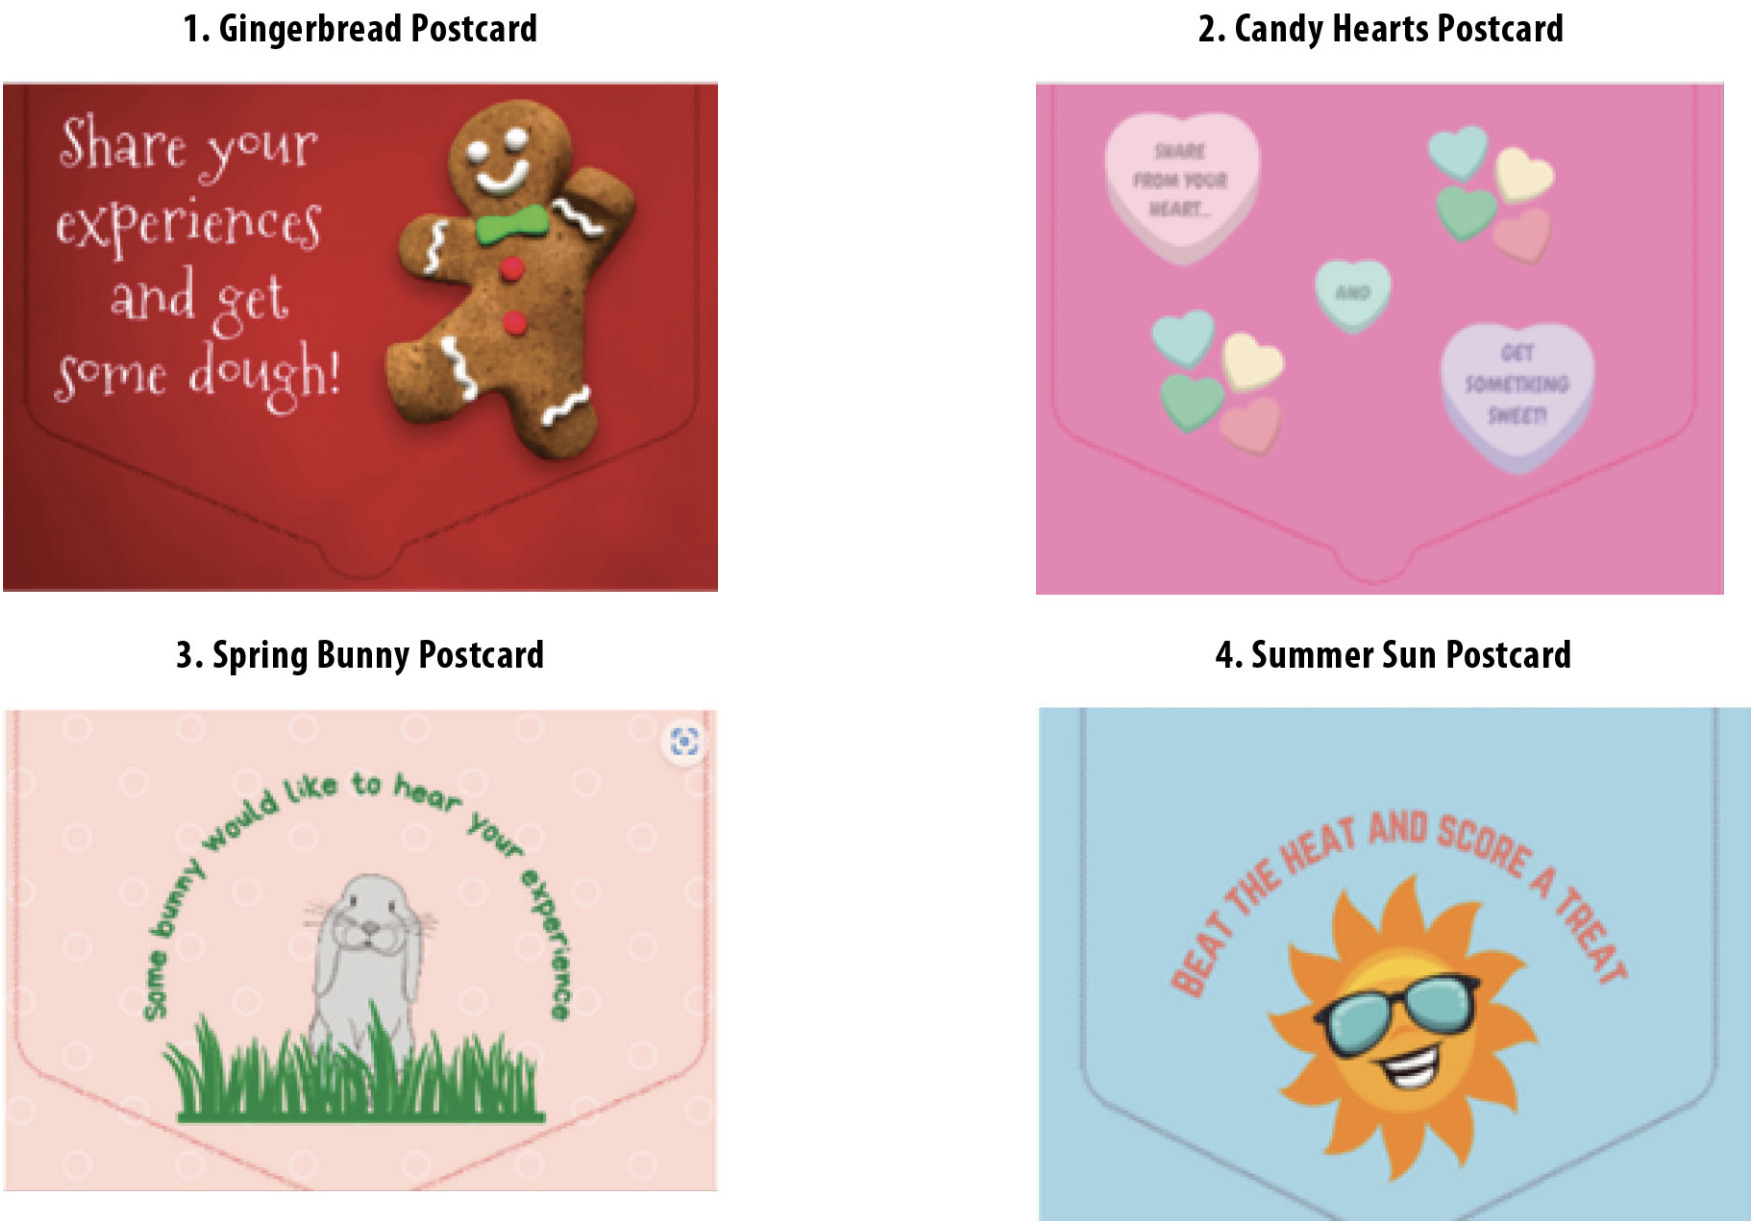
In Cohorts 1 through 7, postcard reminders were mailed 6–8 weeks after the initial survey invitation to those who had not completed the survey. We created four themed postcards with messaging around different seasons of the year to coincide with when the postcard was mailed (Figure 1). In keeping with the seasons and non-denominational holidays, we created and mailed (in this order): a winter gingerbread-themed postcard, a February candy design postcard, a springtime bunny postcard, and a summer sunshine postcard. We used Canva, a free-to-use online graphic design tool, to develop the designs for the postcards and then worked with our printing vendor to transfer the designs from Canva to the postcard itself. Data collection started in September 2021 and finished at the end of September 2022.
What We Found
A total of 6,277 eligible women were contacted at least once and invited to complete an online survey across the eight cohorts. The average response rate after initial survey invitation ranged from 6% to 19% across all cohorts (Table 2). Among the 339 women in the first two cohorts, the response rate after the initial mailing was 18.2%. Cohort 3 mailings using standard materials yielded a response rate of 10.8% while the enhanced recruitment material, the tie-dye envelope, resulted in a response rate of 12.2% (Table 2). The response rates after the initial survey invitation in Cohorts 4 through 7 (tie-dye envelopes only) ranged from 5.9-14.5% (Table 2).
A logistic regression was conducted using Cohort 3 survey respondents from California. This is the only cohort in the study that received all three envelope types at the same time. Only race and stage of cancer were significant factors in survey completion, not envelope type (Table 3). In the analysis, the odds of a Black or African American respondent completing the survey was approximately half that of a White respondent, which is reflected in the lower response rates of the survey. Respondents with a later stage of disease, regional or distant, were approximately 25% less likely to complete the survey. Response rate by cohort and race are included in Table 4.
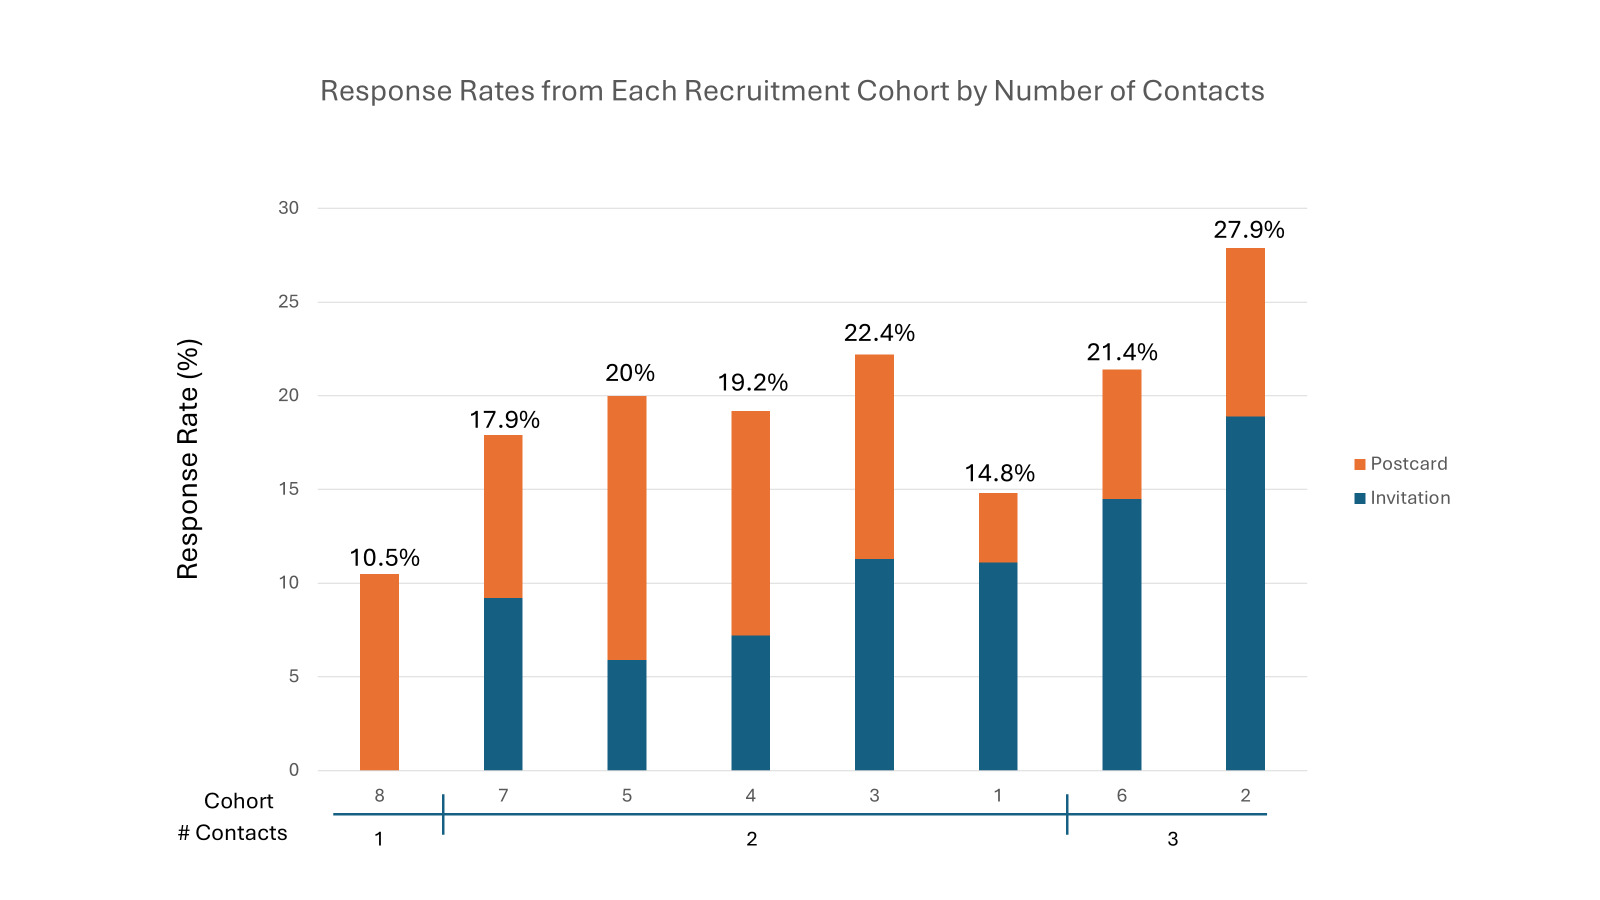
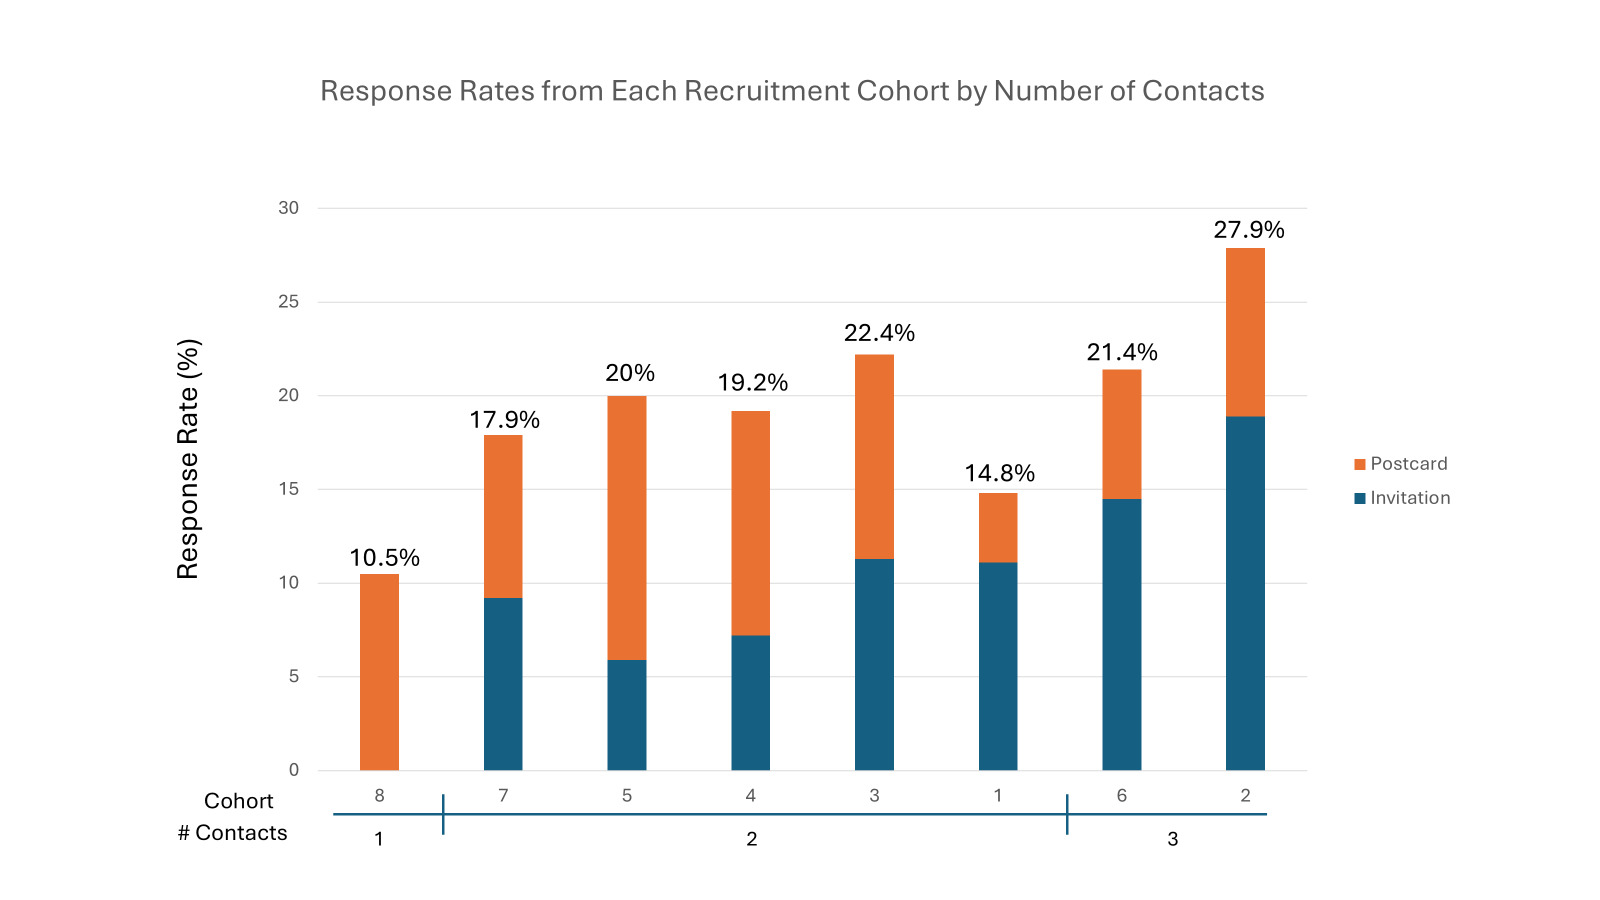
Postcard reminders boosted responses by an additional 4%–14% with the overall (initial mailing and follow-up reminder) response rates of 15%–28% (Figure 2) across all cohorts. Postcard reminder response rates varied compared to the initial mailing across the cohorts. In Cohorts 4 and 5, the response rate from the postcard reminder exceeded the initial survey response rate by 5%–8% (Table 2). Response rates for postcard follow ups in Cohorts 3 and 7 were comparable to response rates following the initial survey invitations.
In a logistic regression of Cohorts 2, 4, 5, and 7 (all Texas cohorts), there was no significant difference across postcard design in whether respondents completed the survey after receiving a postcard. Due to timing of the registry data delivery, Texas was the only state that had eligible participants across each of the four cohorts where a different postcard design was sent based on the time of year. Finally, owing to an administrative formatting error, Cohort 2 in Texas received two initial letters introducing the survey. We conducted a logistic regression across Texas cohorts to identify whether multiple mailings increased response rate. There were no significant differences in race or cancer stage distribution across cohorts, although Cohort 4 had slightly more respondents with late-stage disease (39.1% compared to 32%–35% in other cohorts, p = 0.07). The regression in Texas allowed us to examine both number of mailings and timing of mailings, as each cohort was sent invitations at different times in the year. Cohort 2, with two mailings, had the highest response rate, while Cohorts 4, 5, and 7 had significantly smaller responses (Table 5). In the analysis, respondents in Cohorts 4, 5, and 7 were almost half as likely to respond as the Cohort 2 respondents who received two mailings. In other words, by sending two mailings, it seems that the odds of replying were almost doubled. As in previous analyses, respondents with a later stage of disease, regional or distant, were approximately 35% less likely to complete the survey.
Once time of year (cohort) and stage were controlled, race was no longer a significant factor in response. These results are unique to this analysis, suggesting that either the number or timing of mailings may have increased the rate of response among Black or African American respondents. Further research is needed to identify the factors involved, although a recent study found that multiple-mode surveys were most effective in increasing response rates among Black patients (Elliott et al., 2024), who generally have lower response rates than those among other racial or ethnic groups for surveys conducted by mail (Griffin, 2012; Klein et al., 2011).
Based on logistic regression results, envelope type did not appear to impact response rate, and seasonal postcards had a non-significant neutral or positive impact on response rate (results not shown). Figure 2 displays a graph of the response rates for each cohort of recruitment. The highest overall response rates were achieved in Cohort 2 (18.9%, white no window envelopes) and Cohort 3 (22.2%, tie dye envelopes). After all attempted contacts were complete, we reached a response rate of 19.5% across the entire study sample.
Public Health Context
To improve survey response, we assessed whether a colorful tie-dye mailing envelope would improve response to an initial survey invitation compared to invitations mailed in a white envelope. Our findings suggest that the tie-dye envelope did not consistently improve response rates; response rates using this envelope were similar to those of both white envelopes. The effect of envelope color was inconsistent both within this study and previous studies (Kereakoglow et al., 2013; Ziegenfuss et al., 2014); there is a gap in the literature as the majority of studies comparing envelopes looked at ink color, size of envelope, neutral colors (i.e., brown and white envelopes), and/or other enhancements such as a sticker or hand-stamped postage on the outside of the envelope (Anhang Price et al., 2022; Brtnikova et al., 2018; Kereakoglow et al., 2013; Ziegenfuss et al., 2014). We observed the highest initial response in the two cohorts that included a second invitation mailing (Cohorts 2 and 6). The additional invitation mailing appeared more influential in improving response rate than the use of a tie-dye envelope.
We then explored whether seasonal postcard reminders could boost response rates above those seen for initial survey invitation mailings across study cohorts. Seasonal postcard reminders, on average, generated response rates comparable to those following initial mailings. Use of non-denominational graphics (e.g., gingerbread man during winter holidays, bunny during spring) and a catch phrase that played off the graphics while also encouraging survey participation (e.g., Share your experiences and get some dough!; Some bunny would like to hear your experience) may have contributed to the success of the postcard reminders. Prior research suggests that reminders generally have a positive impact on survey participation (Dillman et al., 2014) and many studies have found that participants who receive two or more reminder notices, show a larger boost in response rate (Anhang Price et al., 2022; Jia et al., 2021; Sammut et al., 2021; Sauermann & Roach, 2013; Svensson et al., 2012; Van Mol, 2017). Conversely, some studies have shown that sending one to two reminders had a nominal effect on response rates, though sending three to five reminders had a significant negative impact on response rates (Holtom et al., 2022; Smith et al., 2019). While the literature seems divided, the response rates generated from our post card reminders appear to indicate that seasonal post card reminders have a neutral or positive impact on response rates.
Limitations
The main limitation of the analysis was that the study from which these data were drawn was not designed to assess the effectiveness of different recruitment materials. Thus, we did not have a control group for the postcard reminders to quantify the impact of a seasonal postcard as compared to a standard reminder postcard. Another limitation is that materials were selected or developed by project team members without input from the priority populations. Future research may benefit from end-user input in the selection of envelopes and development of postcard reminder content (i.e., images selected, wording used) which may contribute to a higher response rate than was observed in this study. This analysis is limited to observations of breast cancer survivors in three states and may not be generalized to a broader population due to limitations in location and health status. Additionally, as the postcard reminders were seasonally tailored, the time of year including holidays and patient travel may have impacted response rates. Finally, further research is needed to see whether these results can be replicated in other patient populations, race-specific groups, and in other languages.
Conclusion
We aimed to improve response rates to a web-based survey with innovative recruitment methods including a colorful tie-dye envelope and seasonally tailored postcard reminders. We found that the tie-dyed envelope did not consistently improve response rates over a standard white envelope while postcard reminders boosted response 4%–15% over initial survey completion rates. We observed the highest initial response in the two cohorts that included a second invitation mailing preceding the postcard reminder; it appears the additional invitation mailing could have been more influential in improving response rate than the use of a tie-dye envelope. This exploratory analysis may inform future studies focused on using innovative recruitment methods to boost response rates in survey-based research and suggests the effectiveness of tailored reminder notices. Our findings contribute to existing observations of survey response behavior and suggest that multiple participant contacts consisting of multiple invitations paired with tailored recruitment methods, such as seasonal post cards, may be useful for researchers seeking to boost survey participation.
Data Availability Statement
The data supporting the current study are available from the authors upon reasonable request.
Acknowledgements
The authors thank Leila Kahwati, MD MPH (RTI) for comments on a draft of this manuscript. The paper was based on data collected during a CDC-funded study titled Patterns of Mammography Screening Study (Contract# 200-2019-F-06756/75D3011906756) conducted by RTI International. The RTI authors received support for this manuscript from the RTI Fellows Program (Dr. Leila Kahwati). No authors had a conflict of interest. No copyrighted material, surveys, instruments, or tools were used in the research described in this article.
The findings and conclusions in this report are those of the author(s) and do not necessarily represent the views of the Centers for Disease Control and Prevention.