

Background
Donors, policy makers, and program implementers increasingly rely on private sector engagement to achieve global development objectives. Effective private sector engagement can lead to additional resources leveraged for development, local ownership, and solution sustainability. United States Agency for International Development’s (USAID’s) Private Sector Engagement Policy has been a lynchpin of its Journey to Self-Reliance and serves as a call to action to institutionalize private sector engagement as a core tenet of USAID’s operating model (USAID, 2019).
There is no blueprint for private sector engagement, and evidence on the impact of private sector programs is limited (OECD, 2018). A meta-analysis finds that “business support to small and medium enterprises (SMEs)” improves firms’ performance on average (Piza et al., 2016); however, as articulated by Fischer & Karlan (2015), SMEs face a range of complex challenges, so no particular intervention has been identified as effective in stimulating their growth.
Facilitation funds (also referred to as challenge funds or matching grant programs) are a common tool for engaging the private sector and leveraging donor funding to achieve additional private sector investment. There are many ways to design these funds, but they generally use grants to de-risk or incentivize private firms to invest their own resources in expansion or upgrades. Such funds constitute one type of blended finance, an approach increasingly favored by donors but for which evidence is still limited (Heinrich-Fernandes, 2019). Because grants to the private sector are a form of subsidy to individual market players, a common implementation question is how to minimize the risks of donor dependence and negative market distortion (Tewes-Gradl et al., 2018). Evidence for this question often relies on anecdotes or case studies; aggregating results across a fund portfolio is challenging because ideally, measurement should be customized to reflect the different business goals of each individual grant or partnership (Kessler, 2018). Often, these funds—like other blended finance mechanisms—are measured based on a simple leverage ratio of donor to private sector funding. Although useful, this ratio does not help implementers understand the profitability—and therefore the sustainability—of the investments that the funds support.
The purpose of this study is to investigate the return on investment (ROI) for one such fund: the $5 million Value Chain Competitiveness Fund (VCCF) implemented by the USAID Private Sector Driven Agricultural Growth (PSDAG) project in Rwanda. Although the entire fund was $5 million, this study looks at only the $3.2 million portion of the fund dedicated to agribusiness investment. We analyze the fund from three perspectives—USAID, the partner business, and a hypothetical external investor—to determine its cost-effectiveness and viability as a tool for crowding in private investment. We seek to answer three research questions:
-
What was the social return on USAID’s investment in the VCCF?
-
Did businesses supported by the VCCF see a positive return on their own investment?
-
Were VCCF investments a valuable first step toward accessing private investment for SMEs?
The results of the analysis will inform the design and implementation of similar funds on future donor-funded programs.
Overview of PSDAG and the VCCF
The PSDAG project was a 5-year (August 2014–August 2019) USAID-funded initiative implemented by RTI International. The goal of PSDAG was to increase incomes of small-holder farmers by promoting private sector investment by assisting the Government of Rwanda (GOR) to increase private sector investment and facilitating private sector investment by upgrading agricultural value chains.
PSDAG leveraged a VCCF that provided grants paired with complementary technical assistance to catalyze relationships between private investors, financial institutions, and value chain actors. The VCCF was designed to help a range of actors, including agribusinesses, cooperatives, financial institutions, and associations to de-risk investment in agriculture and facilitate the adoption of improved technologies for value chain upgrading. These actors received matching grants that required them to co-invest in expansion plans that would help them to grow their businesses. Grants and co-investments supported acquisition of new capital equipment, such as processing equipment, expansion of supply chains, and training and technology adoption to meet market quality standards. Matching grants and technical assistance are two common interventions deployed to help agribusinesses grow, though there is great heterogeneity in how they are implemented across countries and projects.
Data Sources and Analytical Methods
Data Sources
We aggregated data from the following three sources into a central database, which was then used for analysis.
PSDAG Monitoring and Evaluation (M&E) Data
The primary source of information for the database was the PSDAG project M&E Data. All businesses that received grant capital or business development service support from PSDAG were required to report quarterly on a set of pre-determined indicators (a full list of PSDAG indicators is included as Appendix A). We aggregated this quarterly data into annual results for a series of indicators, such as value of domestic and export sales, value of gross farm income, number of supplying farmers, and value of agricultural credit accessed. The data were collected on an ongoing basis from 2014 to 2019.
The project’s M&E data were rich but had some limitations. Grantee reporting was only required for a 2-year period, which would not capture returns to major capital investments often realized over a longer time horizon. The PSDAG indicator definitions were also a limiting factor. USAID/Rwanda defined investment as capital investment (e.g., equipment and other durable, non-expendable goods), exclusive of any working capital investment, operating costs, or human resource investment. As a result, the M&E data captured only a portion of the value of the private sector partners’ investment. Additionally, PSDAG only captured the sales value of agricultural commodities, excluding the sales of services provided (e.g., aerial crop monitoring, mechanization services, or mobile information platforms). Because of these limitations, we collected additional data from the following two sources.
Online Business Survey
The online business survey was designed in Office Forms and supplemented our understanding of grantee sales, financing accessed, investment, and employment before, during, and after the grant. The full questionnaire is available as Appendix B. We invited all VCCF partners to participate in the survey in March 2019. For most businesses, this was after their engagement with the PSDAG project had ended. The survey response rate was 70 percent. One respondent did not write their name in the survey, and their business data were inconsistent with any enterprise information we had from other sources; thus, it was excluded from the database. We recognize that the potential for bias among these respondents, because those who received the most benefit from participating in the VCCF may be most likely to respond.
The data from the online business survey were valuable in providing supplementary data, particularly for sales. However, it also had limitations. For example, businesses were reticent to provide some sensitive or proprietary data through an online platform, so questions about profit margins and interest rates were removed to maintain a high response rate. The survey also identified businesses willing to engage in more in-depth discussions.
Key Informant Interviews
The last phase of data collection was in-person, in-depth interviews with VCCF grantee businesses. Of the businesses that indicated in the online survey that they were interested in discussing their experience further, RTI researchers interviewed 16 in May and June of 2019. The interview questions included the interest rate and profit margin information missing from the above data collection methods, as well as qualitative information related to our research questions: how the business did or did not benefit from the engagement; which ancillary PSDAG services did they access; and are they poised for future growth and additional investment. The survey questionnaire used within the in-person interviews is available in Appendix C.
Analytical Methods
Under the VCCF, PSDAG awarded competitive grants to a broad range of private sector actors, including agricultural SMEs, cooperatives, associations, and research institutes. In this paper, we analyze only PSDAG grants to profit-seeking businesses. Additional grants were made to cooperatives and associations, but these types of organizations have a dual focus on service provision and member support, which differentiates them from the profit-seeking businesses.
We use only the costs attributable to a specific firm, which include the value of the grant and any technical assistance or business development services contracted for that firm. There are additional associated costs to USAID—for example, project staff required to administer the fund and informal technical assistance—which cannot be disaggregated by grantee and therefore were not included in the calculations.
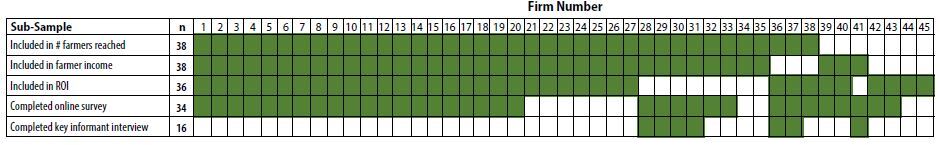
For each method, we are limited to analyzing only the sub-sample of firms that reported the relevant data. Because different firms had different reporting requirements, we use different sub-samples for each analysis. Figure 1 illustrates the five different sub-samples and how the total 45 firms analyzed overlap across them.
Methods: Social Return on Donor Investment
Donors goals do not typically match those of an investor or financier who may focus purely on business performance. Thus, we measure “social” returns as the number of farmers reached through the program, farmer income generated, and inclusion of vulnerable populations in productive value chains, which traditional financiers would not consider.
We calculate average cost to USAID per farmer reached by dividing the total VCCF expenditure (on firms required to track farmers) by the number of farmers reached, as reported by those firms. Although the number of farmers reached is a metric often tracked by donors, it does not alone convey any ROI in terms of impact, because farmers can be reached in any number of different ways. We therefore also analyzed the income of the farmers reached by VCCF-supported firms. To determine the ROI in terms of farmer income, we divided total farmer income (from firms required to track it) by the amount of VCCF funding received by those firms. We also disaggregated this analysis by firm size and their focus crops.
Methods: Return on Business Investment
We calculated the cost to the business as the amount of capital investment recorded in the grantees’ M&E data, which is likely an underestimate because of the definition of the indicator described in PSDAG Monitoring and Evaluation (M&E) Data. To calculate returns to the business, we used sales as recorded during 2019. For those grantees that stopped reporting before 2019, we used the latest reported year (2017 or 2018.) These numbers came from the project M&E data rather than survey data, because it is the most comprehensive source and enabled us to look at the VCCF as a whole rather than just at the subset that responded to the survey. However, some grantees were not required to report on sales data and were excluded from this analysis. Of the 36 firms included, 17 reported their estimated net profit margins during interviews conducted in 2019. For those that were not interviewed, we imputed conservative estimates for margins based on market data and the margins of companies operating similar models. Some firms were excluded because of a lack of adequate market information on which to base imputed margin estimates.
We assume that grantee profits and sales remain constant at their highest reported rate during the project. This is a conservative estimate, given that the Rwandan economy is growing at a rate of 8.6 percent annually, and most VCCF partners were poised for high growth following these investments.
To calculate the payback period of an investment, we used two methods:
-
The payback period for an individual firm’s investment is calculated as Total Investment Cost divided by Annual Profits, using an unweighted average for 36 firms.
-
We also calculated the payback period for the entire investment—both the firm’s investment and USAID’s contribution—to understand if the investment would have been a profitable endeavor even in the absence of donor support. We include only 90 percent of USAID’s portion given that some costs are higher because of a USAID reporting requirements but assume that this portion is financed at a 16 percent interest rate over 18 months, which are standard terms for business loans in Rwanda. This is also calculated as an unweighted average.
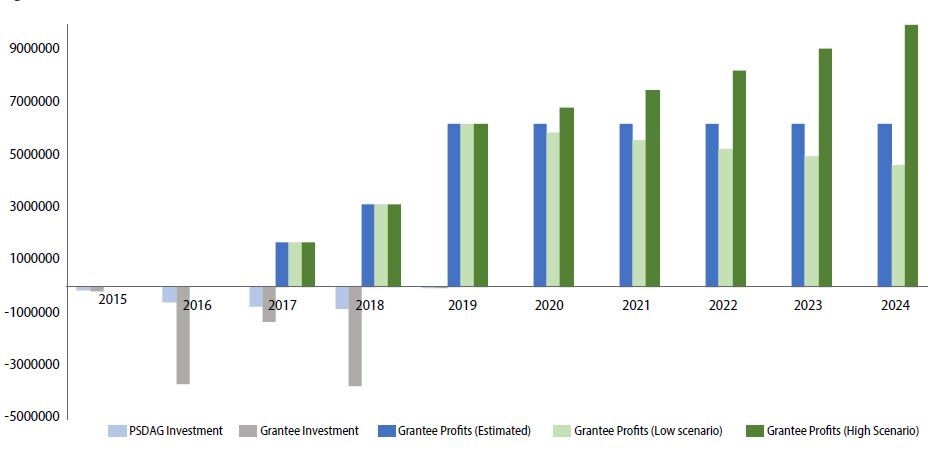
We calculated the net present value (NPV) for the portfolio of VCCF investments for a period of 10 years (5 project years and 5 years following the project) using a discount rate of 12 percent as is standard in USAID economic analysis (Belt & Zuvekas, Jr., 2014). Because NPV relies heavily on assumptions, we also conducted some simple sensitivity analyses to generate upper- and lower-bound estimates. For the “low” scenario, we assume grantee profit margins decline by 5 percent annually. Because many of these firms are first movers, they face limited competition, which is expected to increase in the future and may drive down prices. In this scenario we also impose a flat 20 percent reduction in total cash flow in future years to reflect potential macroeconomic shocks, such as climate, trade, or policy impacts. For the “high” scenario, we hold the macroeconomic scenario and profit margins constant while allowing for a 10 percent annual increase in revenues (compounded), to reflect that most of these businesses were at the beginning of growth trajectories when data collection ended.
Note that for our NPV calculations, we do not calculate the NPV of USAID’s cash outflows but rather the combined cost of USAID and the grantees’ investments to estimate the profitability of the investments more realistically. Costs were allocated to the years in which the partnership agreements were signed. In reality, the costs were likely spread over the 2 years following the signing of the agreement. The NPV for only USAID’s investment would be much higher. Using these methods, results cannot be attributed to the VCCF alone. Per USAID’s indicator definitions, businesses reported gross sales, not incremental. Furthermore, we have no counterfactual and therefore cannot estimate what the firm would have done in the absence of USAID’s support.
Methods: Pathway to Private Investment
Access to capital remains a critical challenge for agricultural SMEs across Sub-Saharan Africa, and private investment offers an alternative to commercial lending for those businesses that can attract it. Recent literature articulates the need to develop a deliberate graduation strategy to move businesses into an “investable” stage, recommending that limited seed capital and a business development service (BDS) would be an appropriate step to prepare for mezzanine finance (quasi-equity) and venture capital (Van Manen, 2018). Here, we examine the VCCF, which provided subsidized seed capital and technical assistance, as a potential modality for such a graduation.
Our data do not allow us to calculate the appropriate metrics to gauge investment readiness post-intervention, and we lack adequate sequential years of reporting to calculate accurate growth rates for the businesses. The World Bank has constructed investment readiness scores using four components: market attractiveness, founder/team, product/technology, and traction (Cusolito et al., 2018). We summarize key characteristics that can be linked to investment readiness, including
-
growth stage of companies analyzed;
-
median annual revenues, approximated by commodity sales reported during the company’s last reporting year to PSDAG;
-
average profit margin, as stated by firms participating in key informant interviews;
-
percent of firms receiving BDS. Investors require a certain level of management capacity, including a governance structure, reporting practices, and compliance standards. While receiving BDS is a proxy for building these types of capacity in a business, most of this was capacity building around basic business practices and would not be sufficient to prepare the firms for investment; and
-
number and description of firms accessing private investment.
Results
Table 1 provides a summary of the agribusiness awards made under the VCCF.
The VCCF-supported firms worked in a range of different crops, as illustrated in Figure 2. Within those crops, the firms provided services varying from input sales to value addition. Some firms were crop agnostic, providing services like financing solutions applicable to any value chain.
Social Return on Donor Investment
Through VCCF support to agri-SMEs, USAID reached 46,272 farmers. The average cost per farmer reached was $63.05. (See Table 2 for a summary of results.) The majority of farmers were reached through grants to small enterprises (as opposed to medium or micro). This was largely driven by two grants that reached over 10,000 farmers, leading to a lower cost per farmer among small firms. Small value grants (under $50,000) also had the lowest cost per farmer.
The total farmer income reported was $22,868,174. As a percentage of the $2,659,795 in capital grants and technical assistance provided to those grantees, this represents an 860 percent ROI. Small grants (less than $50,000) and grants to microenterprises had the lowest ROI in terms of farmer income generated per dollar spent by USAID. Mid-sized grants ($50,000–$100,000) and grants to medium sized firms generated the highest ROI. We also compared the farmer income generated from grants to horticulture businesses, which are higher value and often export-oriented, with grants to businesses operating in staples value chains (like maize, beans, and potato). Staples grantees provided a much higher ROI in terms of farmer income per dollar of USAID investment. This was largely driven by a few large firms that reported over $1 million in farmer income.
In addition to impacting farmers and their income, the VCCF was intended to integrate marginalized groups, including women, youth, and persons with disabilities (PWDs), into the commercial agricultural sector. From a donor perspective, this is an important social ROI. In the absence of a dollar value to quantify this return, we surveyed the 27 businesses that participated in PSDAG’s gender equity and social inclusion program and found that as a result of their participation, all had hired or structured full-time contract farming arrangements with youth (1,500); 24 (89 percent) had hired at least one woman or more, with women averaging 40 percent of all full-time equivalent staff within reporting enterprises; and 21 (78 percent) had hired one or more PWD, creating 96 total full-time equivalent jobs for PWDs.
Return on Business Investment
Payback Period
Assuming that 2019 profits remain constant, the average payback period for a firm’s investment is 6.4 years. The median payback period is only 2.1 years. The payback period for the full investment (firm + USAID) increases to 10.9 years, with a median of only 3.8 years.
Net Present Value
The NPV of the VCCF is $12,524,456 (in 2015 dollars). This is calculated only for the portion of the portfolio that reported sales. Cash flow projections for all three scenarios are shown in Figure 2.
Businesses’ Perceived Value and Qualitative Results
In the online business survey, RTI asked one question related to the impact of the PSDAG partnership on the business. Question 18 (full survey available in Appendix B) asked “How would you rate the utility of PSDAG partnership for your business’ growth?” Grantees were given a Likert Scale of five options between “Not at All Useful” and “Extremely Useful.” Of businesses that responded to the survey, 92.1 percent rated the partnership as either “Extremely Useful” or “Somewhat Useful.” The single business that reported the partnership as “Neutral” was acquired before the conclusion of the grant and thus ultimately cancelled before being completely paid out whereas one of the two businesses that reported the partnership as only “A Little Useful” was cancelled early due to the business not meeting technical and financial requirements of the grant agreement.
The in-depth interviews with businesses revealed the sub-elements of VCCF support perceived as most valuable. For example, many grantees cited access to commercial lending as a valuable outcome of the partnership, crediting their ability to get loans to PSDAG’s support and “stamp of approval.”[1] Some had been trying to get the same credit from the same banks for years and were only successful after partnering with PSDAG: “Without PSDAG, any attempt to get finance would be in vain.” This was especially true for recipients awarded under the social inclusion requests for application.
The interviews also revealed positive trends emerging within the financial sector, which can be partially attributed to PSDAG and are alleviating some of the long-standing constraints to agribusiness financing in Rwanda. These include new working capital lending products with an 8 to 10 percent interest rate as opposed to a standard 16 to 20 percent generally seen in the sector, a new market entrant offering factoring (working capital loans backed by invoices), and supplier credit from equipment suppliers.
Another piece of support recognized by grantees as critical to their success was the BDS program, which built capacity in business operations and helped them identify which products were most profitable, better track expenditures, and increase their future bankability through accurate cash flow and revenue forecasting.
The last key element cited as valuable by grantees was the community of practice that formed among the participating businesses, enabling them to develop a professional network that had not previously existed among agribusinesses in Rwanda. Similarly, the interviews elucidated the value of the technical guidance provided directly by PSDAG staff to the businesses, ranging from guidance related to business, facilitation of introductions to GOR or other partners to expedite customs processes, and creative problem-solving to meet milestones or modify grants. One grantee noted in an interview that “PSDAG is impact driven and the staff were selected well; they are not NGO people but are business-oriented so can provide the right guidance.”
Pathway to Private Investment
PSDAG invested in SMEs of various sizes and stages; Table 3 summarizes the growth stage of the SMEs before engaging with the project.
In our sample, median annual (commodity) sales of VCCF businesses were only $144,533 in their final complete year of reporting. For the firms who completed in-person interviews, the average stated profit margin was 43 percent.
Among VCCF businesses, 58 percent received BDS support. Of these, three firms did access equity investment after receiving tailored investment readiness support from PSDAG. Table 4 provides a summary of these three firms, the support they received, and the investment outcome.
Discussion
Consistent with McKenzie (2011), our sample is small and heterogenous; thus, we do not have statistical power to detect treatment impact. Furthermore, without a counterfactual, we do not attempt causal attribution of effects to VCCF support. To our knowledge, no similar analyses have been published, so we cannot benchmark our findings against existing literature. The discussion below attempts to contextualize and unpack the results of our analysis.
Our analysis shows a positive return on USAID’s investment in terms of farmers reached and farmer income generated. This is a conservative, lower-bound estimate, only representative of what was achieved and tracked during the period of USAID’s investment, which averaged less than 2 years per grant. Given that the supported business models were designed to sustain over time without additional donor support, we can reasonably expect the same levels of farmer income to continue in future years. Farmer income is measured only based on sales reported to VCCF firms. Farmers are likely to have other income from intercropping and multiple harvest seasons per year not related to the VCCF. Farmer income does not necessarily reflect farmer profits, because we had no way to estimate the costs of labor and inputs for farmers.
We further show that the VCCF supported profitable investments and that the value of both USAID’s and the businesses’ investments will be recouped through profits in the medium term using conservative assumptions. Follow-up surveys and interviews triangulated this finding, clearly conveying that VCCF businesses perceived the partnerships as valuable and that the businesses are continuing to thrive after the grants have closed.
The payback period for the initial investments was skewed by several outliers. High payback periods resulted from government intervention and regulatory changes mid-grant that severely impacted original business plans and from delays in receiving equipment that delayed implementation, resulting in low sales reported in the final project year. ROI was calculated holding 2019 sales constant. For these firms, it would be reasonable to assume much higher sales for 2020, but without a basis for estimating those sales, we used 2019 figures. Additionally, the largest investments are slowest to realize and therefore not captured within the grant period. Experimental evidence has shown that impacts of SME support programs emerge 2 years after the program (Bruhn et al., 2018). One outlier was Rwanda’s first commercial mushroom producer, which invested over $1 million to develop a facility for substrate production and associated equipment such as a tractor and baler; facilities for mushroom production; and cold room and cold trucks to keep perishable product preserved. This company only reported $183,000 in its final grant year when it was still completing the investment. Sales were expected to grow substantially, but we conservatively estimated the payback period using annual sales of $183,000. So while this investment had the highest success in terms of leverage ratio, it shows a payback period of 17 years.
VCCF support led to private equity investment for three businesses. The majority of the portfolio was not positioned to receive private investment before engaging with the project. These businesses are small—most falling within the “missing middle,” meaning that their financing needs are too small to justify the transaction costs for an investor. Although the stated average profit margins of those who responded exceeds 15 to 25 percent minimum ROI for investment funds (Cusolito et al., 2018), the size of the businesses would likely still not be attractive to investors. Although private investment is often touted as a high potential alternative for SME finance in capital-constrained markets, it is not an appropriate solution for the majority of these firms, which are generally representative of Rwandan agribusinesses: small-scale, with low managerial and financial capacity, unlikely to attract an outside investor or fund. Such businesses are on the lowest end of the missing middle are more appropriately financed through microfinance institutions or commercial banks, which 26 percent of the businesses accessed with PSDAG support. The VCCF support and subsequent commercial financing could be a first step on the “graduation” pathway to investment for a subset of growth businesses, but intermediate steps—such as mezzanine financing and substantial additional BDS—would be required, as recommended by Van Manen (2018).
Conclusions and Recommendations
From this research, we conclude that facilitation funds such as the VCCF are a viable modality for engaging private sector partners and can offer positive returns to both the donor and businesses. We offer the following recommendations for designing and implementing similar funds:
Build ROI analysis into fund processes. As for any business investment, expected ROI should be calculated before a grant is made. This should be done in partnership with the grantee, and in most cases will be a capacity-building exercise in and of itself. Project staff should be trained to use basic tools for calculating expected returns. As several partners noted in interviews, staff with business backgrounds are critical.
Equity investment is not always the end goal. Although financing is a real constraint to growth, in markets like Rwanda, equity investment may not be an appropriate alternative to credit. Businesses are small and have returns that could not offset due diligence and transaction costs for investors. Facilitation funds should have a clear method for identifying which partners are—or could become—investable and offer tailored investment readiness support. But for the majority who are not, funds should have a roadmap for unlocking commercial lending.
Tackle financing from both the supply and demand side. Much of the VCCF’s success was because of its facilitation of access to finance for agri-SMEs. On the demand side, VCCF support helped grantees access credit. The grant applications themselves doubled as business plans, the capital grants provided them with collateral, BDS built their financial capacity, and the PSDAG “seal of approval” improved their bankability. On the supply side, PSDAG developed partnerships with banks with true commercial interest in expanding agricultural lending and incentivized them to deliver through results-based agreements. Although the supply has improved, most lending available is high interest and shorter term than the median investment payback periods.
Tracking and measurement. There were several limits to the PSDAG project data that made it difficult to conduct this analysis. To fully understand the performance of businesses within a fund, we recommend systematically collecting general information on sales, lending, and investment, which then can be disaggregated as needed to meet donor-prescribed indicators. Firms may not be able to calculate their profit margins—or may be wary of doing so. We recommend working with BDS service providers to develop a system for grantees to monitor their profits over time.
Acknowledgments
The authors thank RTI contributors Elizabeth Eckert and Sarah Mattingly for their contributions to this research and RTI intern Daniel Stevenson for supporting data entry and cleaning. We thank the United States Agency for International Development (USAID) for funding and supporting the Private Sector Driven Agricultural Growth (PSDAG) project and the entire PSDAG team for their tireless efforts implementing the Value Chain Competitiveness Fund. Most importantly, we acknowledge PSDAG’s partners from the Rwandan private sector. This research was funded by RTI International using publicly available data from the USAID/PSDAG project.
Quotes have been edited for English clarity, and we have not attributed quotes to specific grantees because all partners were informed the interviews would be kept confidential and only used for aggregate reporting.