
Introduction
Global temperatures are rising, heightening the importance of understanding population vulnerabilities to extreme weather. Pregnant women and developing fetuses are particularly vulnerable to heat stress, and exposure to elevated temperatures has been shown through multicountry studies to increase risks of stillbirth and preterm birth worldwide and in Africa, via biological mechanisms such as dehydration and heart conditions (Davenport et al., 2020; Li et al., 2023; McElroy et al., 2022). The threshold of heat danger for pregnant women has not been well defined. Precipitation moderates temperature, and heavy precipitation may indirectly affect maternal and perinatal outcomes through changes in vector-born and infectious disease risks, food security and nutrition, and access to health care (Desai et al., 2007; Ha, 2022; Mafwele & Lee, 2022; Ngongo et al., 2025). No studies of environmental heat, precipitation, and maternal and newborn outcomes have previously been conducted in Senegal.
Average annual temperatures in Senegal increased by 0.2°C per decade between 1960 and 2010 and are projected to increase by 1.1°C to 3.1°C by the 2060s and by 1.7°C to 4.9°C by the 2090s (World Bank & Global Facility for Disaster Reduction and Recovery, 2011). Senegal has experienced a significant decrease in precipitation since the 1960s (World Bank & Global Facility for Disaster Reduction and Recovery, 2011). Indicators of heavy rainfall, like the maximum one-day rainfall and the frequency of days with rainfall ≥ 20 mm, are projected to increase between 2035 and 2060 (Niang et al., 2014). Simultaneously, increased evaporation rates are likely to heighten drought frequency (Niang et al., 2014).
Senegal has made significant strides in reducing maternal mortality. The maternal mortality ratio has halved since 2000, falling from an estimated 581 maternal deaths per 100,000 live births in 2000 to 237 per 100,000 live births in 2023 (World Health Organization, 2026). Neonatal mortality has also improved, declining from an estimated 31 per 1,000 live births in 2000 to 21 per 1,000 live births in 2017 (Diallo et al., 2023; United Nations Inter-agency Group for Child Mortality Estimation, 2024). Despite these gains, neonatal mortality has not yet dropped below 12 deaths per 1,000 live births, as targeted by 2030 in the United Nations Sustainable Development Goals (Boerma et al., 2023; United Nations Inter-agency Group for Child Mortality Estimation, 2018). An estimated 19 stillbirths per 1,000 births (≥ 28 weeks gestation) occurred in Senegal in 2021 (World Health Organization, 2024).
Given the imperative to improve maternal and perinatal health outcomes and the projected changes in temperature and precipitation, this study aimed to assess associations between climate factors and health goals. Data from countries in the tropics can inform discussions regarding appropriate policy responses. We used routinely collected population health data from Senegal’s platform for aggregated health information, DHIS2 (District Health Information Software 2), and temperature and precipitation data collected through remote sensing to evaluate the detectability of climate-health relationships in this persistently hot environment (DHIS2, 2024). We hypothesized that high temperatures and heavy precipitation contribute to increased maternal and perinatal mortality in Senegal.
Methods
We analyzed routinely collected national data on stillbirth and maternal mortality aggregated monthly by health district from January 2018 to September 2022. Senegal collects monthly national health data using DHIS2 (DHIS2, 2026). Health facilities collect and report on health events on their premises and in their catchment areas, although home births may be undercounted. Each health facility enters records into the electronic national health information system, with data then aggregated at district, regional, and national levels. The Senegal Ministry of Health and Social Action provided health district–level DHIS2 data on maternal and newborn outcomes for all 57 months between January 2018 and September 2022 (the last month in 2022 with complete data before a health worker strike).
Health indicators included counts of maternal deaths, stillbirths, and births and live births reported in health facilities. Stillbirths were standardized per 1,000 births, and maternal deaths were standardized per 100,000 live births. The dataset included monthly health district estimates for data completeness (the ratio of expected reports to the number received). We addressed missing data and outliers during data cleaning following the guidance detailed in Senegal’s 2023 Report for the Countdown to 2030 for the health of women, children and adolescents (Diallo et al., 2023). Health data were cleaned, compiled, and analyzed using R through the RStudio platform (R Core Team, 2024).
Consistent with previously reported methods, we obtained monthly temperature and precipitation data at the health district level through remote sensing surveys (Ngongo et al., 2025). Monthly average land surface temperature satellite images were obtained from NASA’s Terra Moderate Resolution Imaging Spectrometer (MODIS) (Wan et al., 2021). We downloaded monthly land surface temperature MODIS rasters with a resolution of 0.05 degrees for our study period (2018–2022). The MODIS satellite images were converted from degrees Kelvin to degrees Celsius (Wan et al., 2021). We applied a zonal-statistic procedure to calculate the mean monthly temperatures for each of the 79 health district boundaries, averaging across all raster values in each health district (Schaffer-Smith & Swenson, 2017).
We downloaded monthly precipitation raster images for our study period (2018–2022) from the Global Precipitation Climatology Center (National Center for Atmospheric Research, n.d.). The center images report total millimeters of precipitation at a resolution of 2.5 degrees. We applied a zonal-statistic approach to average the values of each image pixel contained in each health district boundary.
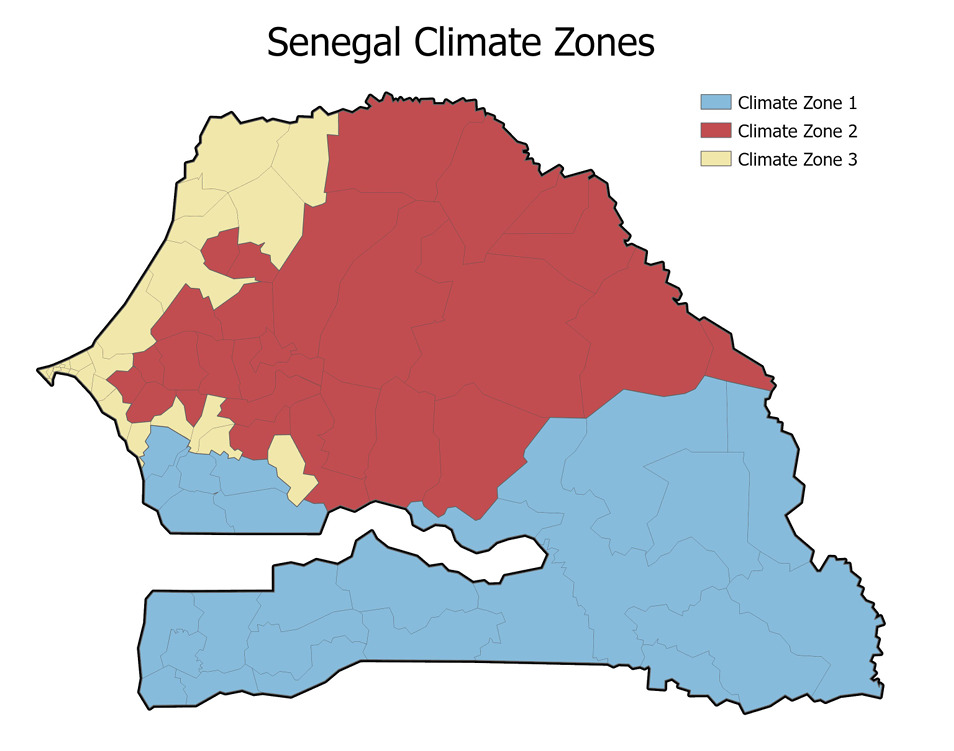
We first conducted our analysis at the national level. When that approach did not result in significant associations, we hypothesized that climate zones would appropriately capture the country’s climatic heterogeneity. We divided Senegal into three climatic zones, applying thresholds informed by the temperature and precipitation data. Climate Zone 1 included health districts with average annual precipitation at or above 700 mm/year and average temperatures under 37°C, clustered in the southern part of the country. Climate Zone 2 included health districts with average temperatures at or above body temperature (37°C) and average precipitation under 700 mm/year, clustered in the center, north, and northeast of the country. Climate Zone 3 health districts had average temperatures under 37°C and average precipitation under 700 mm/year, which generally included western districts on or near the coast (Figure 1). An exception was Goudiry district, which we included in Climate Zone 1 alongside its neighboring districts even though its annual precipitation (660.7 mm) fell just under the 700 mm/year threshold. We stratified reported analyses by climate zone.
We additionally examined extreme weather events, defined as months exceeding the 95th percentile of each weather metric, as predictors of maternal and perinatal outcomes; however, these models did not yield significant associations, and average monthly values were retained as the primary exposure metric. We processed geographical data using Python matplotlib and GeoPandas.
Using the collected health and climate data, we built nonlinear statistical models to assess associations between temperature, precipitation, stillbirth, and maternal mortality. We estimated temporal trends of health and weather indicators using generalized linear models (GLMs) (Chatfield & Xing, 2019) in which the dependent variable was the indicator and the independent variable was the month number, from 1 to 72 (January 2018 to September 2022). Generalized additive mixed models (GAMMs) (Chatfield & Xing, 2019) investigated relationships between variables using the following formula:
HEALTH INDICATOR = TEMP + RAIN + TEMP*RAIN + YEAR + HEALTH DISTrnd
where HEALTH INDICATOR was stillbirth or maternal mortality, RAIN was health district monthly precipitation, TEMP was the average monthly temperature, TEMP*RAIN was the interaction between temperature and precipitation, YEAR was the year, and HEALTH DISTrnd was an unstructured random effect of the health district (Wood, 2017). All numeric covariates were included as nonlinear effects.
Given the possible lag effect of temperature and precipitation on health indicators, we tested alternatives for the time lag in association between climate variables and health outcomes: same month, previous month, 2 months before, and 3 months before. All model specifications included the same number of parameters. We used Akaike information criteria (AIC) to select the best temporal lag. Tested lag effects for temperature exposure were generally not significant, and we retained same-month (no lag) temperature exposure in final models, given the evidence regarding the physiological effects of heat exposure in the final month of pregnancy (McElroy et al., 2022). A lag of 3 months between precipitation and the health event (stillbirth or maternal mortality) was retained, as it had the best (lowest) AIC across models. We also tested the inclusion of an indicator for the rainy season in our temperature models, and we found no difference in statistical significance from the main models.
To assess the statistical power of our samples to detect hypothesized associations between weather factors and birth outcomes, we conducted post hoc power analyses using the pwr package (version 1.3-0) in R. GAMMs do not readily lend themselves to analytic power calculations, so we approximated power using correlation-based estimates via the pwr.r.test() function. A conservative approach could consider health districts as the unit of analysis, and a less-conservative approach would use the total number of recorded observations. The true power of our models likely falls between these two options, given that repeated monthly observations within health districts are not independent.
Assuming previously reported effect sizes (Ngongo et al., 2025) and a two-tailed alpha of 0.05, power estimates for a medium-sized correlation (r = .30) ranged from 77 percent (health district level) to approximately 100 percent (observation level). For a small correlation (r = 0.10), power estimates ranged from 14 percent (health district level) to greater than 99 percent (observation level). Ranges narrowed in the climate zone–specific models: 31 percent to 100 percent for a medium-sized correlation and 8 percent to 98 percent for a small correlation. These results suggest that although the full model was reasonably powered to detect medium to large effects, the climate zone–specific models may have had limited power to detect smaller effects, particularly when accounting for the clustered data structure.
Results
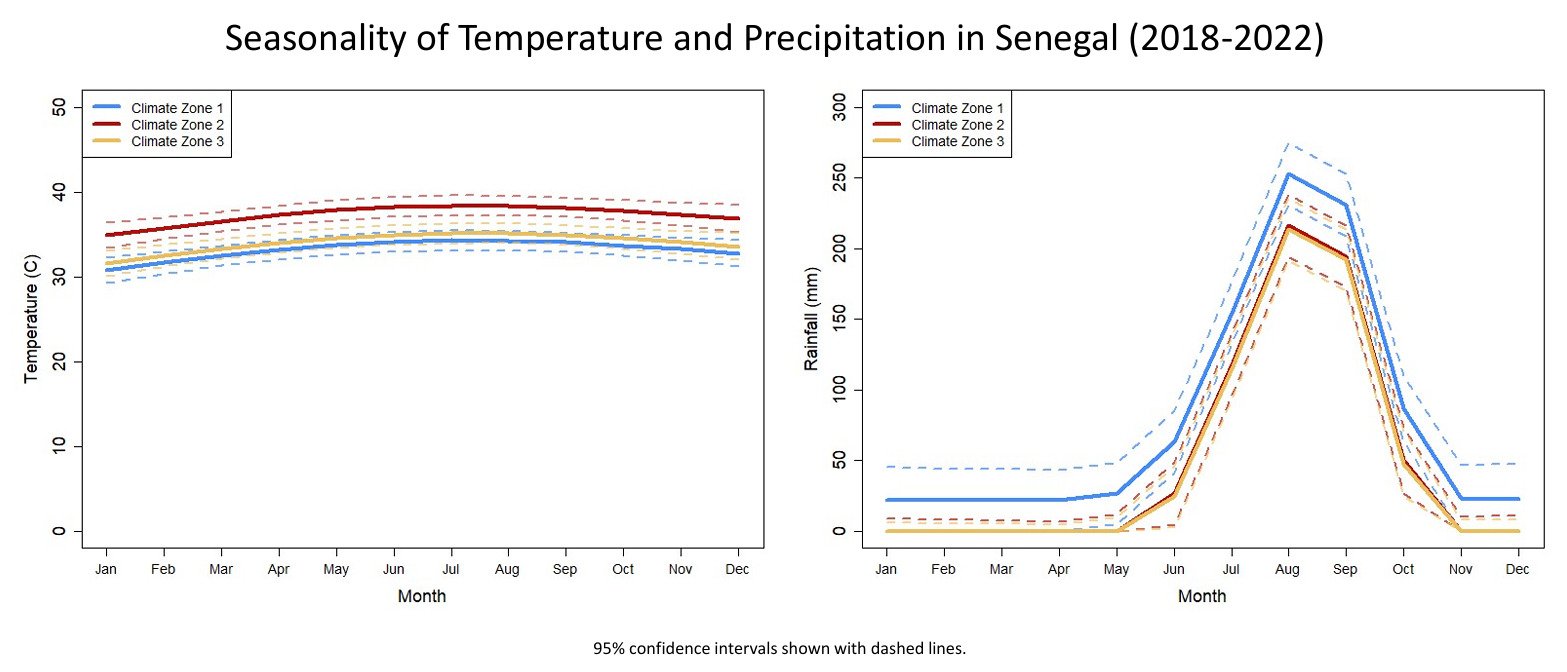
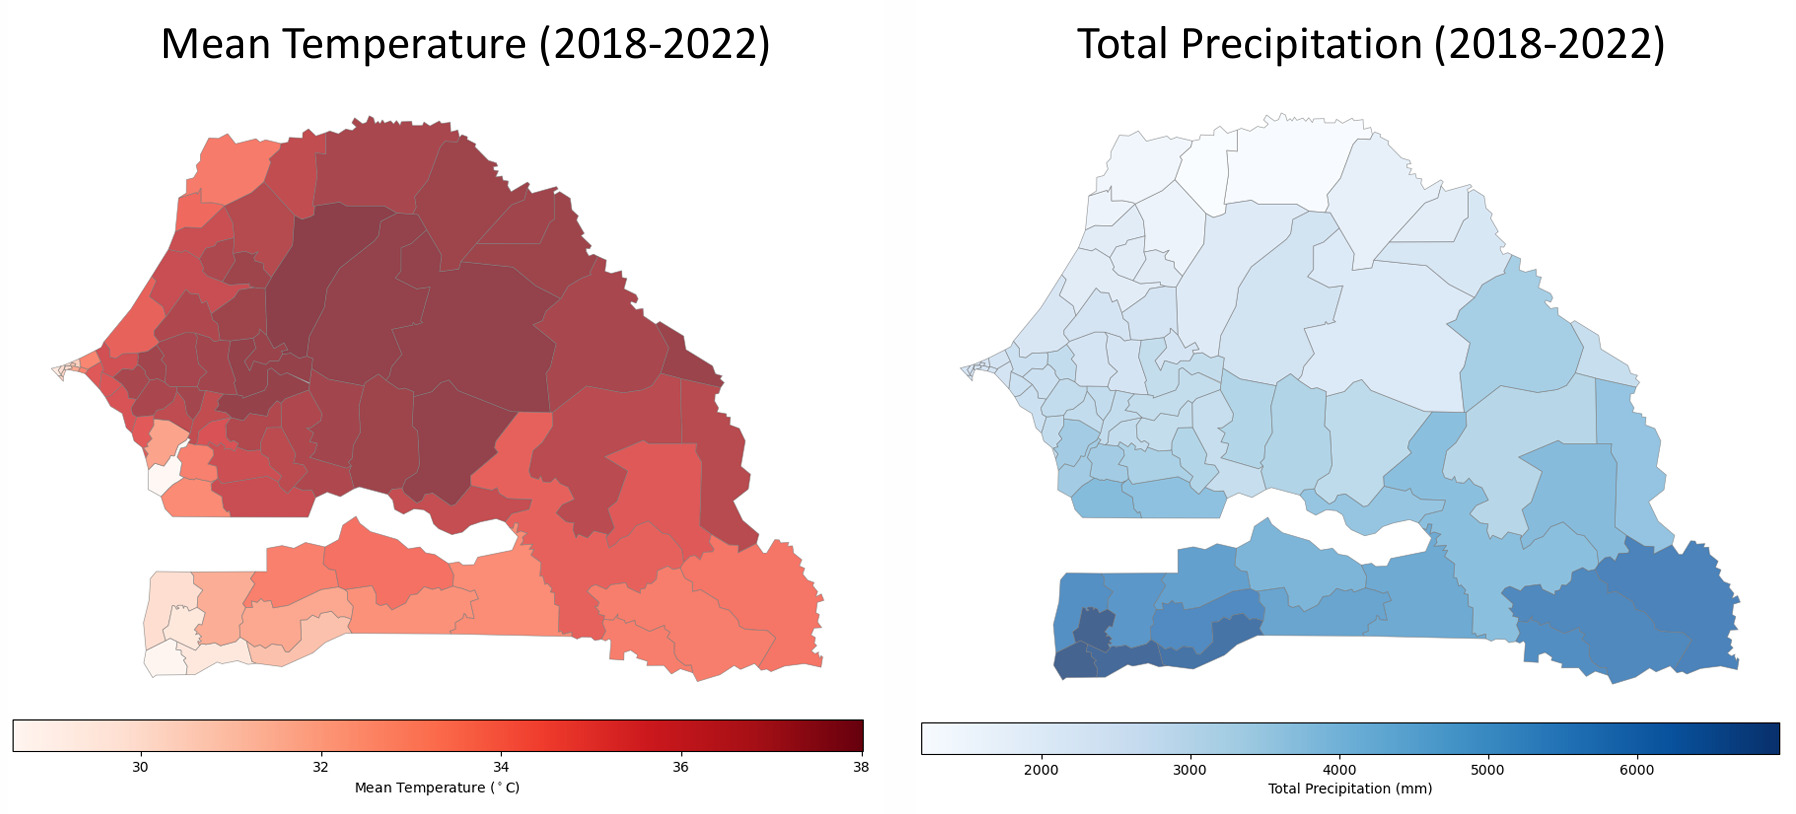
Temperatures were consistently high year-round, with a national average of 34.9°C between 2018 and 2022. Senegal experiences one rainy season each year, with rainfall peaking in August and September (Figure 2). Climate Zone 1 included 25 health districts where precipitation is comparatively high, with an average of 993.1 mm/year between 2018 and 2022 (Table 1). Climate Zone 2 included 27 health districts characterized by high heat, with an average 2018–2022 temperature of 37.5°C. Climate Zone 3 included 27 health districts on or near the western coast where precipitation (average 507.3 mm) and temperature (average 33.9°C) were less elevated than in Climate Zones 1 and 2. Figure 3 maps average temperature and total precipitation by health district.
.png)
_and_total_precipitation_(right)_in_senegal_(2018--2022).png)
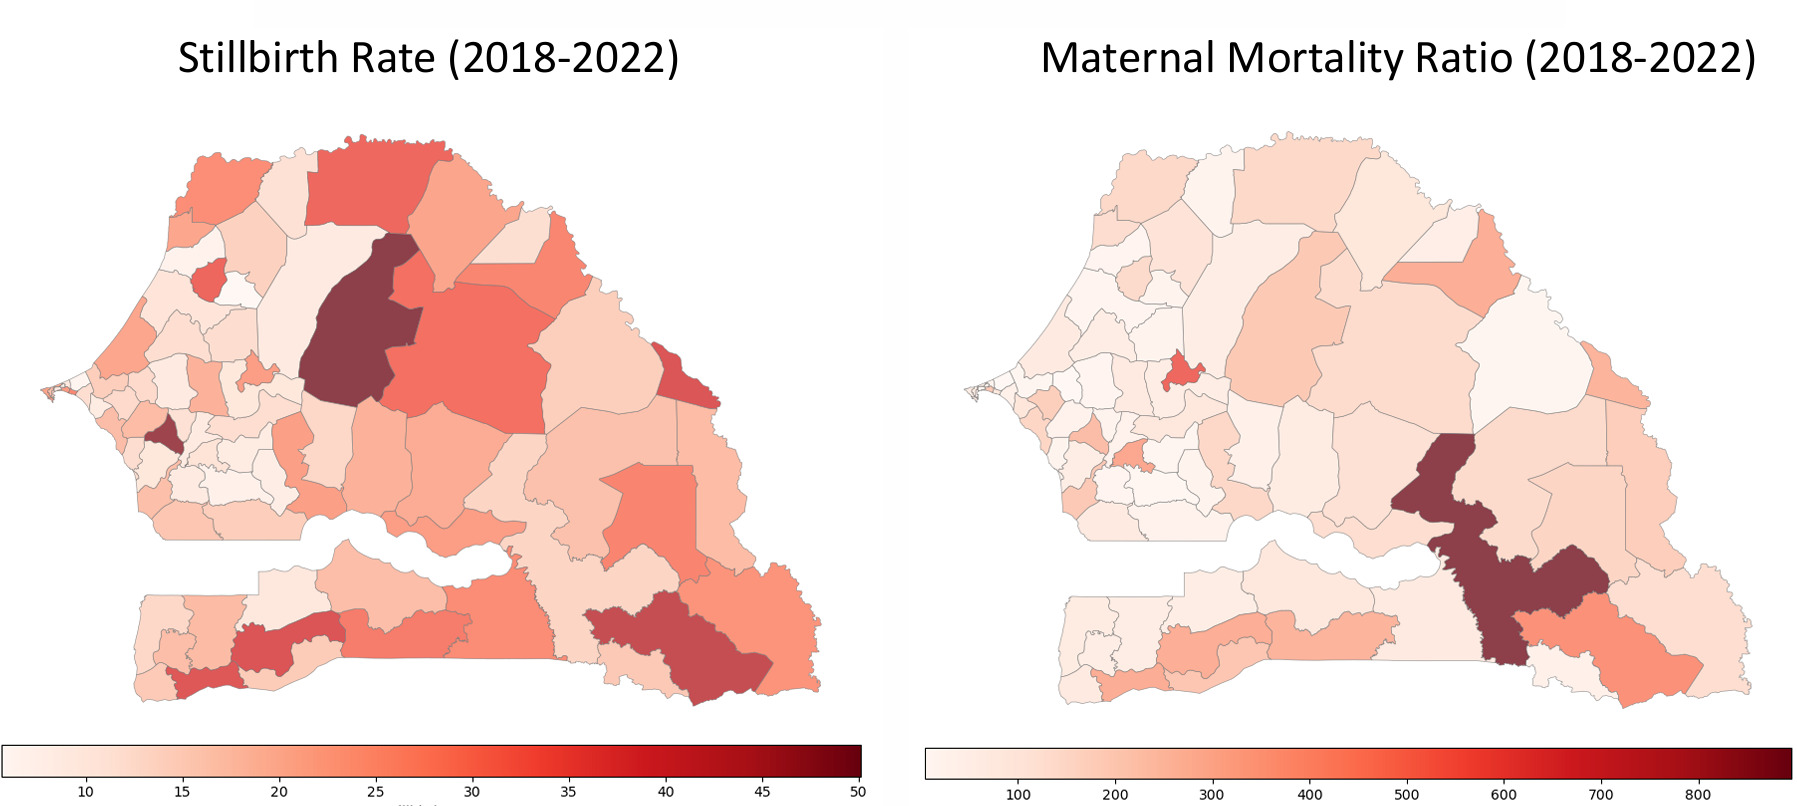
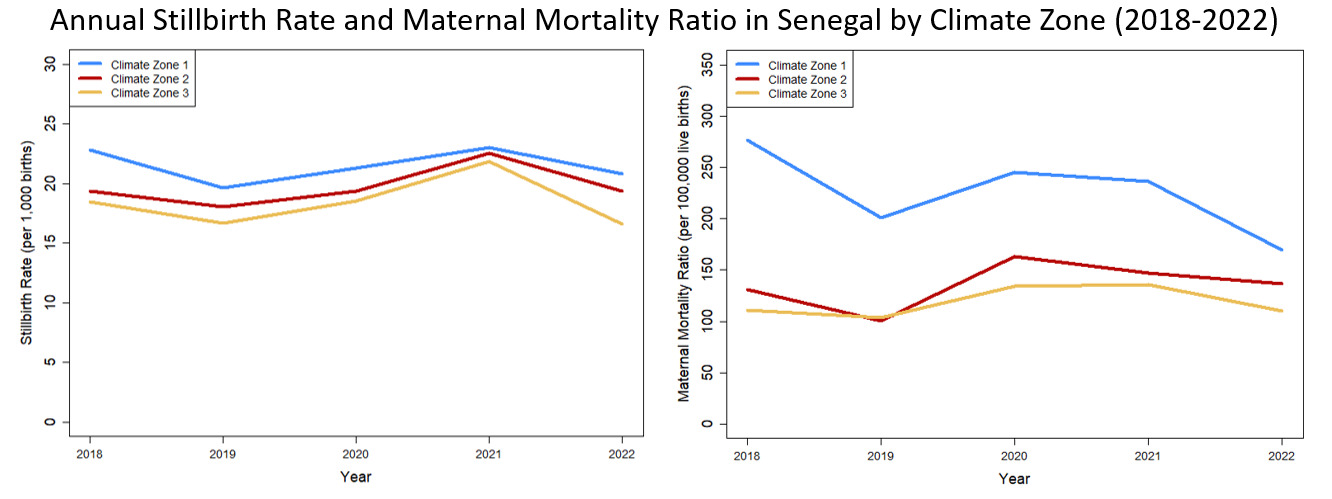
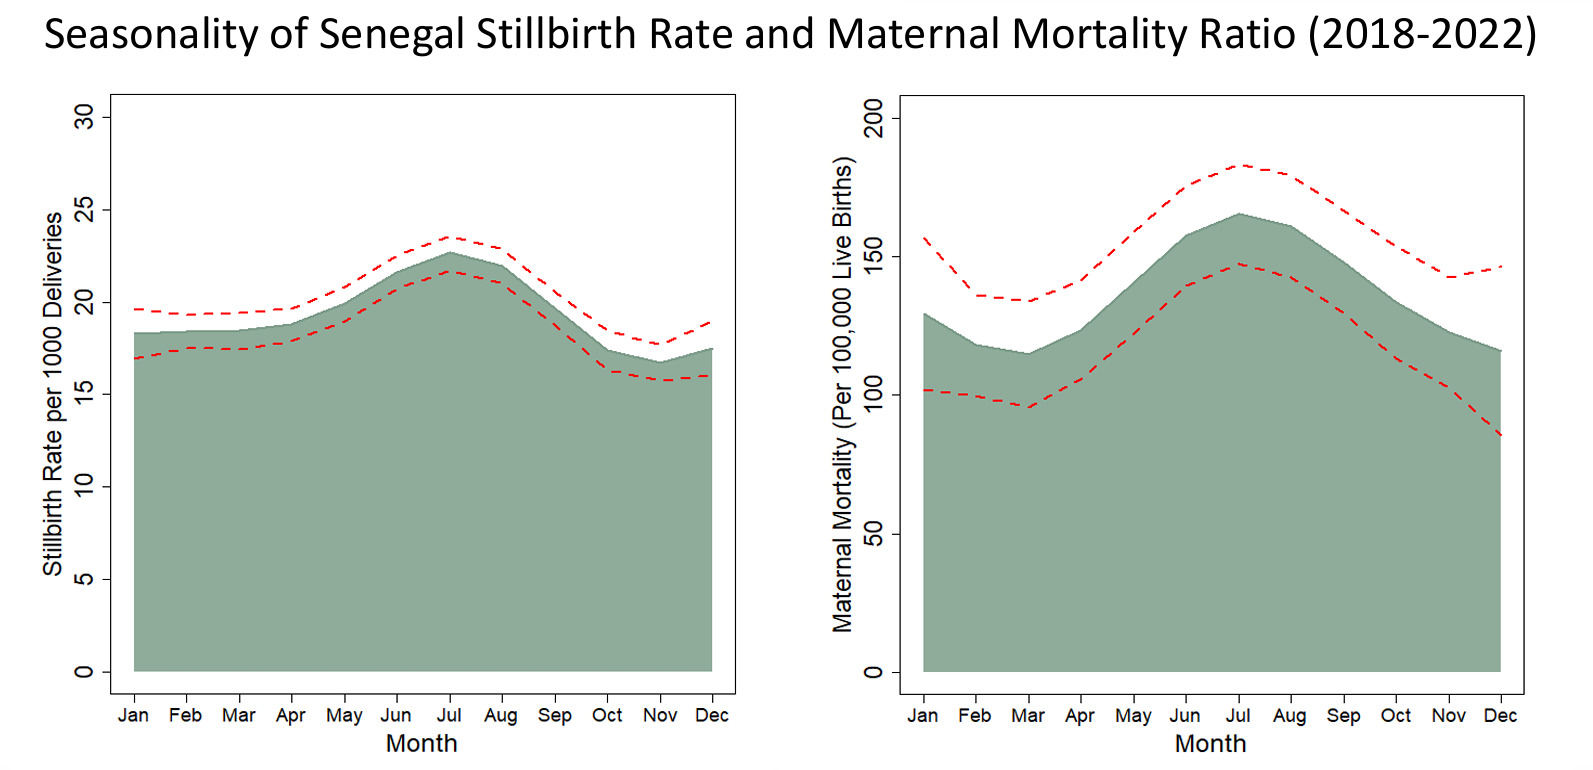
DHIS2 recorded 2,097,903 births in Senegal between January 2018 and September 2022: 504,608 in Climate Zone 1, 699,698 in Climate Zone 2, and 893,597 in Climate Zone 3 (Table 2). A total of 41,190 stillbirths and 3,100 maternal deaths were registered in facilities. Mean monthly stillbirths per 1,000 births and maternal mortality per 100,000 live births varied substantially across health districts (Figure 4). The recorded stillbirth rate per 1,000 births was higher in Climate Zones 1 and 2 (ranging from 18.1 to 23.0) than in Climate Zone 3 (ranging from 16.6 to 21.8) (Figure 5). Geographic heterogeneity was particularly pronounced for reported maternal mortality, ranging from 169.4 to 276.5 per 100,000 live births in Climate Zone 1, from 100.3 to 163.0 per 100,000 live births in Climate Zone 2, and from 103.7 to 135.8 per 100,000 live births in Climate Zone 3 (Figure 5). Rates of stillbirth and maternal mortality peaked each year between June and September (Figure 6). In contrast, reported numbers of live births were lowest each year in June and July, peaking in October and November (Supplemental Figure 1).
_and_maternal_mortality_ratio_(right)_in_senegal_(2018--2022).png)
_and_maternal_mortality_ratio_(right)_in_senegal_by_climate_z.png)
_and_maternal_mortality_ratio_(right)_(2018--2022).png)
Testing associations between same-month heat, precipitation, stillbirth rates, and maternal mortality ratios across the three climate zones, we found that models with a 3-month lag between precipitation and stillbirth/maternal mortality best described the available data. Despite modeling efforts across three climate zones, no models identified a significant association between same-month temperature and either stillbirth or maternal mortality (Table 3). In most models, the association between precipitation and either stillbirth or maternal mortality 3 months later was likewise not significant. The exception was related to stillbirth in Climate Zone 2, where the interaction between precipitation and temperature was significantly associated with stillbirth on a 3-month lag (estimated degrees of freedom [EDF] = 2.30, p = .008), indicating that the association between precipitation and stillbirth varied across temperature conditions, although predicted effects based on this model did not show a strong relationship. Alternatively, without the interaction term Climate Zone 2, precipitation was significantly associated with stillbirth on a 3-month lag (EDF = 2.86, p = .002), but still did not show a strong relationship (Supplemental Figure 2).
Discussion
In this analysis of more than 2 million DHIS2-registered births in Senegal, a country characterized by relatively consistent high temperatures, we did not detect any associations between heat exposure in late pregnancy and aggregated, population-level rates of stillbirth or maternal mortality. Across three climate zones, either precipitation or the interaction between precipitation and temperature was significantly associated with stillbirth in only one climate zone, and that association was after a 3-month lag.
A growing evidence base describes the negative effects of extreme weather events on maternal and newborn outcomes (Davenport et al., 2020). Applying similar methods in the Democratic Republic of the Congo, we previously reported that temperatures greater than 34°C and anomalous heavy precipitation were strongly associated with increases in same-month stillbirth and maternal death and less strongly associated with neonatal mortality, with every degree increase above 34°C associated with an additional 2.3 stillbirths per 1,000 births and an additional 27.3 maternal deaths per 100,000 live births (Ngongo et al., 2025). An analysis from 15 African countries found that a 10 percent increase in the proportion of days over 37.7°C increased the likelihood of a spontaneous abortion or stillbirth by 1.4 percent to 1.9 percent, depending on the strength of the heat wave (Davenport et al., 2020). A study from Benin, Malawi, Tanzania, and Uganda reported that pregnant women exposed to high temperatures in the week before childbirth had a 34 percent higher risk of perinatal death, a risk that doubled during the 6 hottest months of the year and was especially visible in intrapartum stillbirths (Hanson et al., 2024). This combined evidence supported our hypothesis that it would be possible to detect associations between district-level heat exposure and facility-recorded monthly rates of stillbirths and maternal deaths in Senegal.
Although our analysis did not detect an association between district-level heat exposure and adverse birth outcomes, our model comparison suggested that a 3-month lag best described the associations between precipitation and stillbirth and maternal mortality. Although only one model found a significant relationship, the selection of a 3-month lag (as opposed to 0, 1, or 2 months) may reflect the impact of malaria in pregnancy, which is known to increase risk of stillbirth and maternal death (Schantz-Dunn & Nour, 2009). Past investigations have reported a delay of 12 to 13 weeks between precipitation and malaria case confirmation (Bisanzio et al., 2023). Malaria transmission does not typically occur during Senegal’s dry season or in its hottest districts. Precipitation tempers heat and increases humidity, potentially facilitating increases in malaria transmission that drive subsequent consequences for maternal and perinatal outcomes. Infectious disease ecology exemplifies the indirect ways that climate change can affect population health outcomes, meriting further study, planning, and mitigation.
These results should be interpreted in light of several inherent limitations. First, our analysis relied on monthly, district-level data, which does not capture individual-level exposure. Given the structure of aggregated monthly health data, it was not possible to define the timing of exposures relative to gestation. We did not have a record of when in the month each event occurred, and events at the end of a month would have experienced more of that month’s recorded weather than events at the start of a month. This analysis did not capture individual-level exposures or specific characteristics that may influence risk, such as time spent inside and outside the home, physical activity, hydration, and comorbidities. Rather, we sought to evaluate whether routinely available climate and health data could detect maternal and newborn risk signals at population level.
The use of monthly averages was similarly limiting for weather data, as monthly averages do not fully capture acute heat exposure or heavy precipitation events. We could not assess thresholds at which health risks are lowest using the minimum mortality temperature method. We did not have access to weather station data or wet-bulb globe temperature data, which would have better represented the ambient thermal environment by combining temperature in direct sunshine, humidity, wind speed, sun angle, and cloud cover.
Additionally, it is more difficult to identify significant associations when a predictor is consistent rather than variable. Because temperatures were consistently high, they offered little explanatory power regarding the variability of the outcomes in our statistical models. As such, one would expect that it is more feasible to perceive statistical associations between temperature, maternal mortality, and stillbirth in places where temperature fluctuates than in places with little temperature fluctuation. Although further research is needed in countries experiencing ongoing high heat, researchers may experience statistical challenges identifying associations in contexts like Senegal where temperatures do not vary substantially.
We recognize the possibility that our null finding reflects suboptimal quality in the DHIS2 data. Health districts vary in the correctness and completeness of entered data, and home births may be undercounted. DHIS2-reported rates of stillbirth and maternal mortality differ from international estimates, suggesting generalized underreporting in DHIS2. The inverse seasonality between recorded live births and the rates of both stillbirth and maternal mortality suggests that denominators may have been constant rather than changing as expected. Although we addressed data quality concerns by collaboratively identifying and working through data questions and taking a consistent, established approach to data cleaning, DHIS2 stillbirth and maternal mortality data quality may have been insufficient for the demands of this analysis.
As with all country-level ecological research using routine health data, findings should be interpreted in the context of the study design and data structure. Power analyses indicated that the climate zone–specific models may have had limited power to detect small associations at the health district level. Nonsignificant findings should therefore be interpreted cautiously and should not be taken as confirmation of the absence of associations between weather factors and maternal and newborn health outcomes. Future studies may benefit from pooling data across countries to better detect associations of small to medium magnitude.
The threshold of heat danger for pregnant women has not been well defined. Young, healthy, nonpregnant people have been found to experience uncompensable heat stress at 25°C to 28°C in dry conditions and at 30°C to 31°C in humid conditions (Vecellio et al., 2022). These ranges fall well below temperatures across Senegal. In creating climate zones from 2018–2022 weather data, we used a threshold of 37°C—body temperature—to define the hottest climate zone, comprising 27 districts. Although rainfall tempers heat, the average temperature was 33.3°C in the climate zone defined by heavy precipitation (Climate Zone 1). Given a national average temperature of 34.9°C, it may be that all pregnant women in Senegal experience heat exposures above the (not yet defined) threshold of risk.
Communities closer to the equator generally report higher mortality-related heat thresholds than do communities closer to the poles (Hajat & Kosatky, 2010). Under an interpretation of physiological adaptation, thermoregulation during pregnancy may pose fewer challenges to Senegalese women than to pregnant women who experience heat waves in cooler or more seasonally variable parts of the world. It is likewise possible that dramatic increases in heat may affect pregnancy outcomes more than constant baseline heat. Further research is needed.
DHIS2 is a widely employed data solution to understand population health. In other settings, DHIS2 has proven a readily available opportunity to identify trends and associations (Ngongo et al., 2025). Although this analysis did not identify associations between temperature and stillbirth or maternal mortality, health and environmental data should be routinely analyzed to inform health system planning for resilience. Further research may help to elucidate whether and how environmental heat affects the direct causes of stillbirth and maternal mortality (Hanson et al., 2024). Findings may vary across contexts, suggesting the importance of ensuring country-level representation from a diversity of climates.
Acknowledgments
Jay Rineer and Nathan Ellermeier kindly aggregated temperature and precipitation data and created included maps. We appreciate support from Cristina Bisson, Alyson Lipsky, Richard Reithinger, and Paul Weisenfeld.