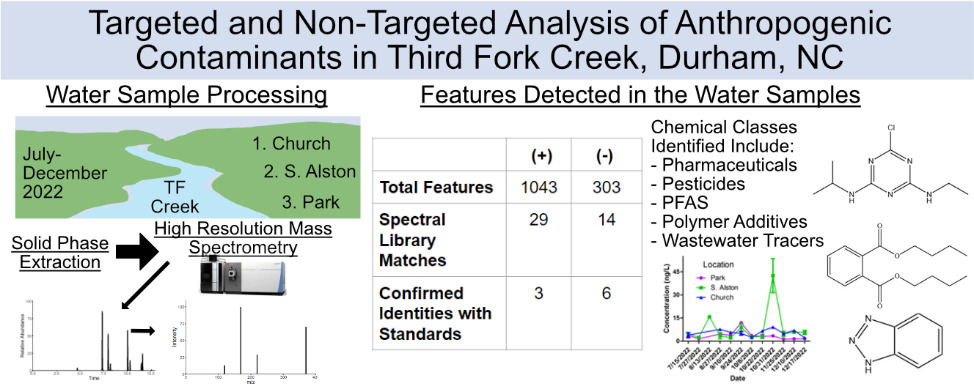


Graphical Abstract

Introduction
Water quality underpins public health, drinking water supplies, fisheries, and biodiversity across North Carolina. The state is home to roughly 10.5 million people, 475 bird species, and 234 freshwater fish species, 57 of which are listed as endangered (North Carolina Wildlife Resources Commission, n.d.). Conventional monitoring programs in the state routinely track physical and biological indicators, such as pH, dissolved oxygen, turbidity, nutrients, bacterial loading, temperature, and salinity, but these parameters do not capture the full range of chemical stressors now present in many watersheds. Rising human activity has introduced diverse pollutants—pesticides, herbicides, heavy metals, per- and polyfluoroalkyl substances (PFAS), industrial chemicals, and polymer additives—that are generally not part of routine monitoring panels (Wang et al., 2024). Targeted chemical campaigns to quantify these contaminants are typically episodic and limited in scope—small, infrequent studies or multiyear surveys—and are resource intensive, often costing hundreds to thousands of dollars per sample, depending on the analyte panel. These constraints limit routine detection of emerging contaminants and increase the likelihood that targeted programs will miss chemicals outside predefined panels as the contamination landscape evolves.
Surface waters in North Carolina, including the Cape Fear River Basin, have long-standing contamination from industrial discharges, wastewater effluent, agricultural runoff, and urban development; notably, the Cape Fear River has sustained PFAS contamination linked to upstream industrial sources for decades (McCord & Strynar, 2019). These North Carolina surface water systems are also vulnerable to episodic mobilization of pollutants during hurricane season: intense rainfall and flooding increase runoff from roadways and urban areas, flush personal care products and other consumer chemicals into streams, and can release contaminants from compromised wastewater infrastructure and storm-related debris—impacts documented following major storms, such as Hurricane Florence and Hurricane Helene (Aly et al., 2021; Hedgespeth et al., 2021; Walker-Franklin et al., 2025). Third Fork Creek (TFC) is a 16.6-square-mile urban tributary within the Cape Fear River Basin in Durham, North Carolina, that flows into Jordan Lake, a drinking water source and recreational resource. TFC is designated nutrient sensitive and has shown declining indices of water quality—its water quality index dropped from 77 in 2021 to 64 in 2022—driven by elevated bacteria, impaired aquatic life, and nutrient concerns (City of Durham, n.d.; North Carolina Department of Environmental Quality, n.d.). Prior work has likewise identified TFC as impaired (Gerald et al., 2021; Spence, 2015). However, existing monitoring in TFC and similar water systems tends to focus on a limited suite of parameters and may miss anthropogenic organic contaminants that could influence aquatic health and remediation priorities.
Targeted chemical analyses are efficient and sensitive for predefined contaminants but necessarily omit many emerging or unexpected compounds (Pariente et al., 2022). Targeted contaminant surveys (e.g., PFAS or pesticide panels) are generally episodic or short campaigns every few years because of analytical costs. Non-targeted analysis (NTA) using high-resolution mass spectrometry (HRMS) complements targeted methods by screening for hundreds to thousands of known and unknown organic compounds in drinking water, rivers, and streams (Allan et al., 2013; Brack et al., 2019; Ruff et al., 2015; Walker-Franklin et al., 2025). NTA is best viewed as a hypothesis-generating and prioritization tool: it can reveal unmonitored contaminants and potential sources, inform site-specific targeted panels, and help prioritize remediation actions (Kutil et al., 2024). At the same time, NTA is resource intensive; its greatest value is strategic—that is, it is used to broaden the scope of inquiry where targeted programs indicate impairment or where land use and potential inputs are heterogeneous.
This exploratory study used NTA to characterize spatial and temporal variability in organic contaminant signals in TFC over 6 months. We restricted sampling to July through December 2022 because of resource constraints and a deliberate focus on the wetter summer to fall period during hurricane season when storm-driven runoff and episodic discharges—and thus contaminant mobilization—are most likely. We acknowledge that winter to spring conditions (e.g., lower runoff, different agricultural application schedules, and temperature-dependent chemical behavior) could produce different contaminant profiles and encourage similar sampling in the future. We sampled three sites spanning 5 miles to capture differences in proximity to urban inputs and land use. Our aims were to (1) document site-to-site and seasonal variation in contaminant composition and abundance and (2) evaluate how NTA results could inform follow-up targeted monitoring and remediation priorities in an already impaired urban creek. We hypothesized that contaminant profiles would vary both spatially and temporally, reflecting localized inputs and episodic events, and that NTA would identify candidate contaminants for prioritized, cost-effective targeted analyses and interventions.
Materials and Methods
Water Sampling
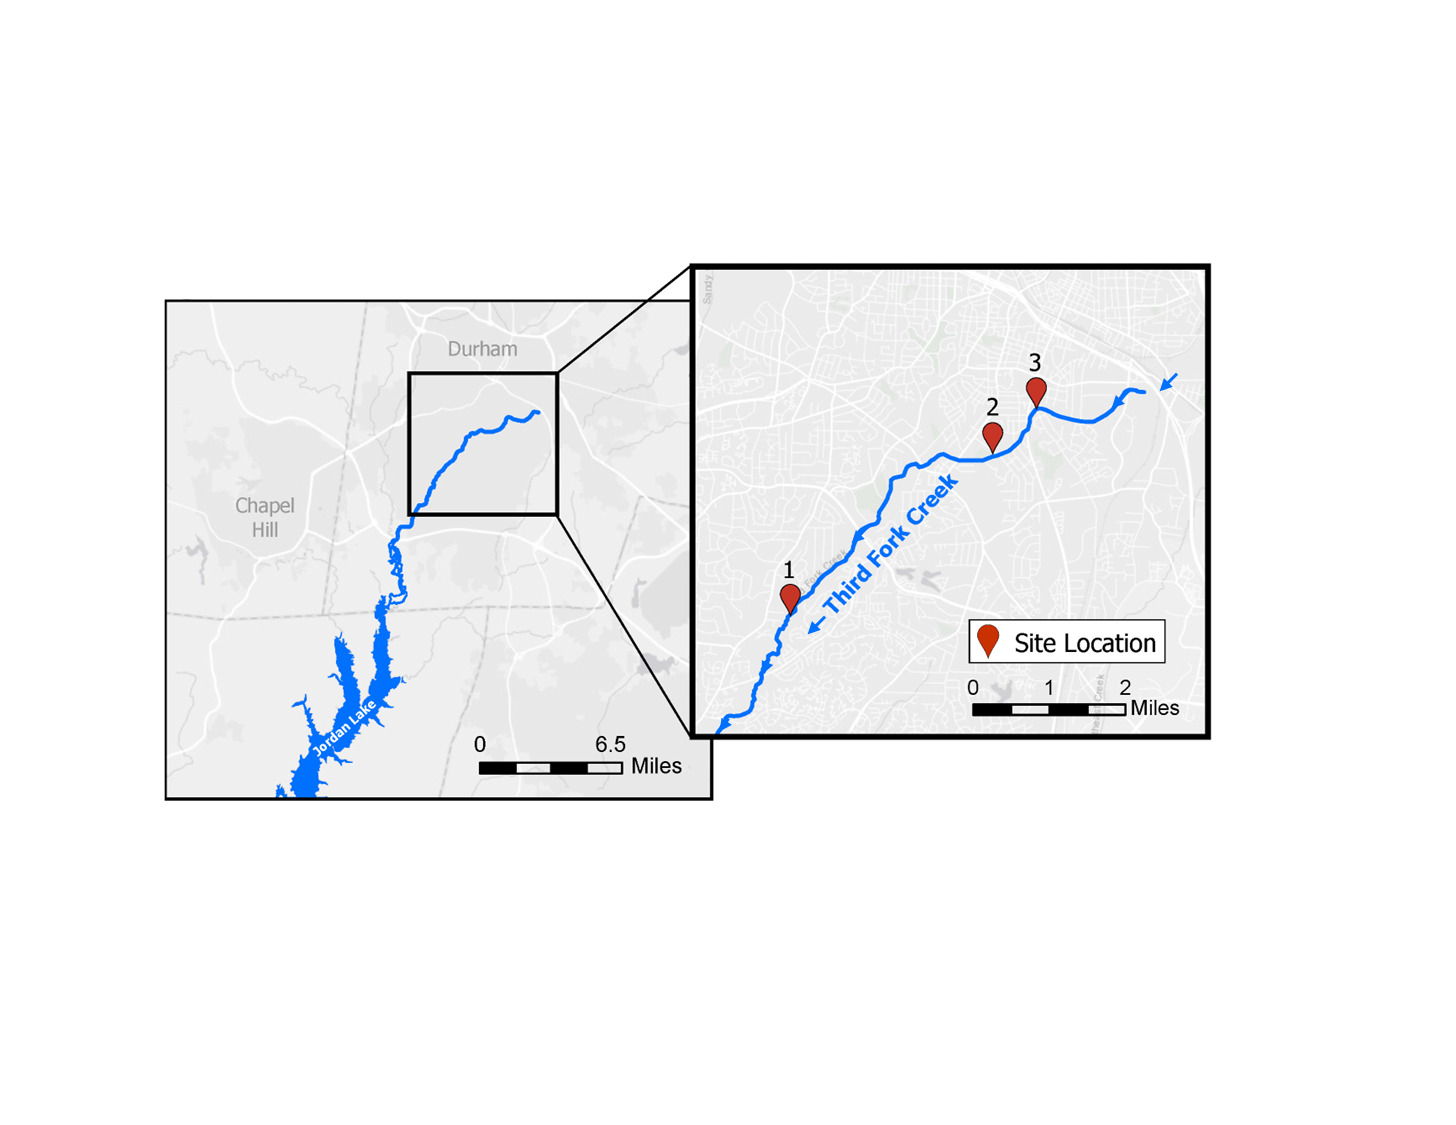
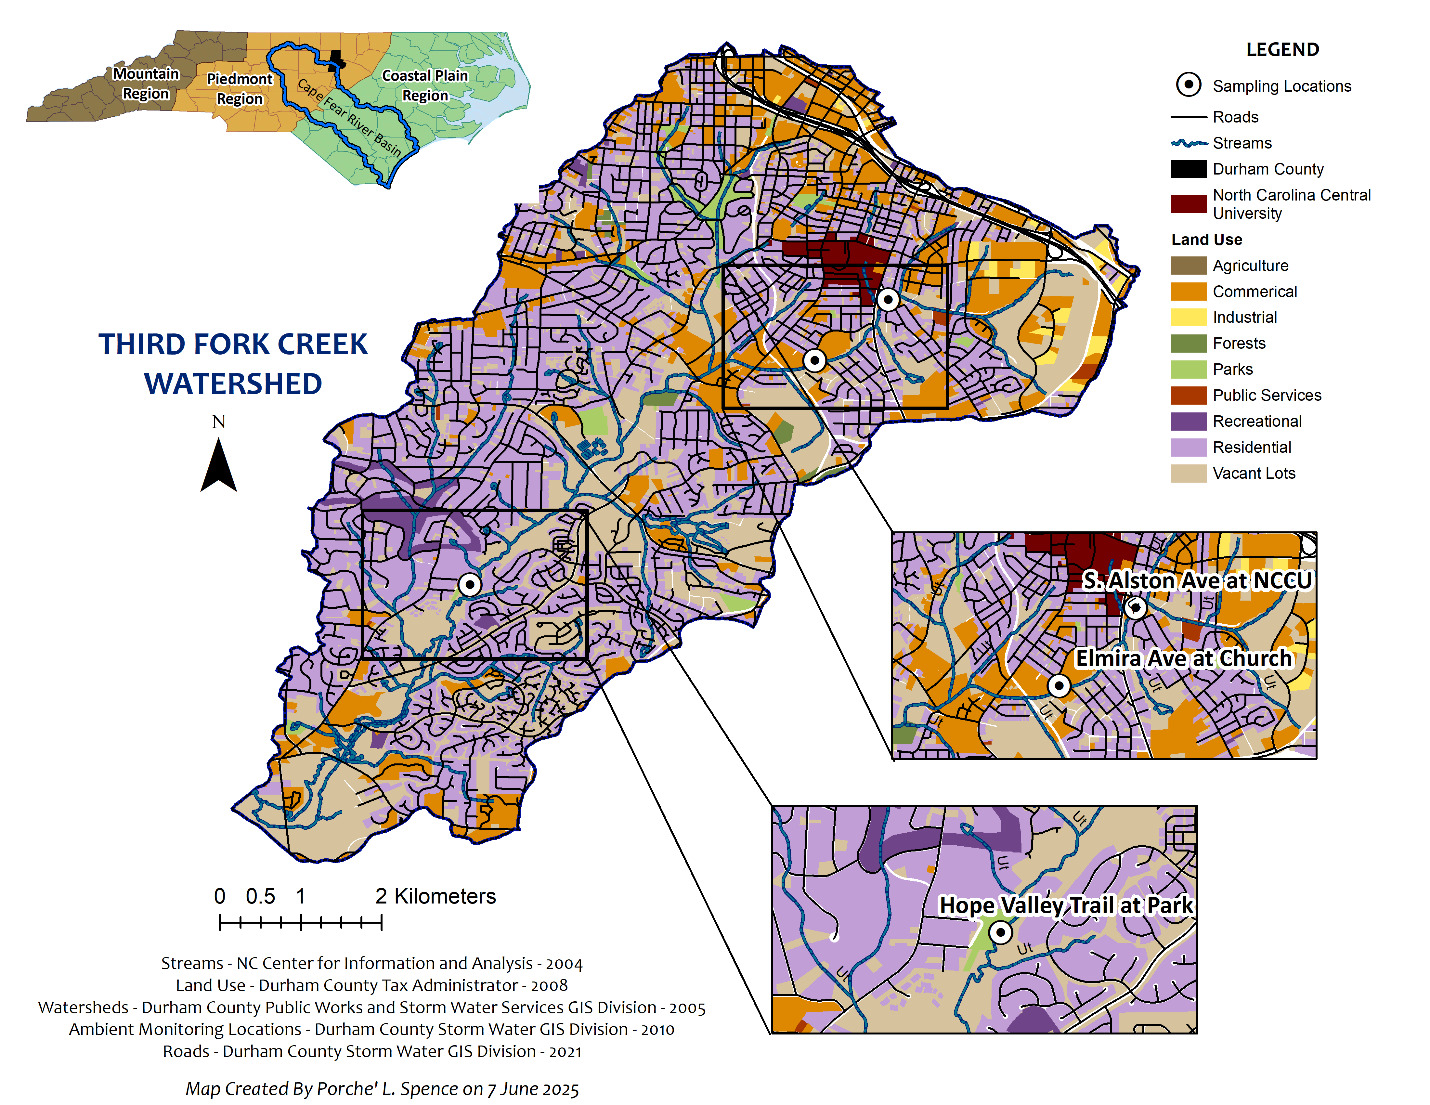
Water samples were collected in three locations along TFC: Site 1 (Park) at Hope Valley Trail (35.938202 N, 78.940282 W), Site 2 (Church) at Elmira Ave./Southside Church of Christ (35.963154 N, -78.901879 W), and Site 3 (S. Alston) at North Carolina Central University (35.970083 N, -78.893596 W), as visualized in the Figure 1 map. Samples were taken over 12 time points from July 2022 to December 2022 across the three locations. Additional parameters including sample location, date of collection and extraction, water levels, water temperature, pH, conductivity, salinity, and total dissolved solids can be found in the Supplemental Information (SI) Table S1, SI Figure S1, and SI Figure S2. Water samples in quantities of 1 liter (L) were gathered from each site in duplicate as grab samples collected in the center of the stream at mid depth using sterilized plastic bottles and were stored on ice after sampling. Samples were transferred to a fridge and stored at 4°C in the dark until preparation for analysis at the same time.
_along_the_third_fork_creek.png)
Materials and Reagents
Organic solvents (water, methanol, acetonitrile, & isopropanol) were high-performance (HP) liquid chromatography (LC) grade purity and supplied by Thermo Fisher (Fairlawn, New Jersey). Organic buffers (formic acid and ammonium acetate) were HPLC grade purity and supplied by Sigma Aldrich (St. Louis, Missouri). The 1 surrogate standard, 4 internal standards, and 34 analytical reference standards used had a purity of 94 percent and above (SI Table S2). These compounds were sourced from Cambridge Laboratories (Andover, Massachusetts), CDN Laboratories (Langley, British Columbia), TCI (Portland, Oregon), Thermo Fisher, Sigma Aldrich, Supelco (Bellefonte, Pennsylvania), and Wellington Laboratories (Guelph, Ontario).
Sample Preparation
One liter of each collected water sample, field blank, and laboratory blank was filtered through 2-micrometer pore size Whatman 47-millimeter glass fiber filters, then a surrogate standard, equivalent to 200 nanograms (ng), was added (Figure 2). Samples were manually loaded onto 200-milligram Oasis Hydrophilic-Lipophilic Balanced cartridges (Waters Corp, Milford, Mississippi). Extracted samples were eluted using 6 milliliters (mL) of 90:10 methanol:methyl tert-butyl ether. Samples were evaporated to near dryness under nitrogen and reconstituted with 1 mL of 95:5 water:acetonitrile. Quality control pools (n = 3) were created by combining aliquots of each sample at all time points. Final samples were spiked with internal standards reaching individual concentrations of 100 ng/mL. After processing, all samples were stored in 2 mL glass vials at -20°C until analysis.

LC-HRMS Analysis
Analysis of water samples was completed by ultra high-performance (UHP) LC coupled to HRMS (UHPLC-HRMS) using a Vanquish Flex Liquid Chromatograph and Orbitrap IQX mass spectrometer (Thermo Fisher Scientific, San Jose, California). LC-HRMS data was analyzed using Thermo Scientific Compound Discoverer Version 3.3 to characterize the environmental contaminants prevalent in the water samples. Data were analyzed using an NTA workflow called the “Environmental with Statistics Unknown ID with Online and Local Database Searches,” which was used to detect and identify unknown compounds with differential analysis, comparing groups by location and month sampled. This workflow completed unknown compound detection, retention time alignment, and compound grouping across all samples. Features were retained only if their peak area was at least five times greater than the corresponding signal in the blank; features below this threshold were removed as background. The identification workflow utilized spectral searches against HRMS libraries (including MzCloud, National Institute of Standards and Technology [NIST] tandem mass spectrometry [MS/MS], and RTI International’s in-house library) in silico MS/MS fragmentation (Mass Frontier), compound class assignment (ClassyFire), and exact mass list matches (<5 parts per million [ppm]) to suspect lists (NIST PFAS Mass List, Polymer Additive mass lists, and DSSTox Database; Djoumbou Feunang et al., 2016; Dührkop et al., 2015, 2019; Williams et al., 2017). Reference standards were used, where possible, to confirm structural annotations. Confidence levels (1–5) in structural annotation followed the Schymanski workflow (Schymanski et al., 2014). Features were denotated as Level 1 confidence matches by manually matching to a chemical standard’s retention time, parent ion mass accuracy (mass-to-charge ratio [m/z] <5 ppm), and MS/MS fragmentation that was run under the same instrumental conditions. Level 2 confidence was manually annotated to features with parent ion mass accuracy (m/z <5 ppm) and MS/MS fragmentation spectral library matches greater than 70 percent within internal spectral libraries (mzVault) or commercial spectral libraries (mzCloud). Level 3 annotations utilized in silico MS/MS fragmentation prediction and compound class assignment algorithms to predict chemical class to annotate the chemical. Level 4 annotations were database or mass list matches using the Compound Discoverer’s predicted formula matches or exact mass matches. Additional details on the data processing and the semiquantitation workflow for Level 1 annotations are further detailed in SI Table S3 and SI Table S4.
Statistical Analysis
Volcano plots used differential analysis (t test or analysis of variance) and determined p values (adjusted p values, ratios, fold change, covariance, etc.) to analyze differences between sample groups, including by location and month sampled. Significant features displayed in the volcano plot are plotted by their log-fold change in abundance greater than 2 and p <0.05. Principal component analysis (PCA) was performed between the groups, which identified and grouped samples with similar peaks, assessing the relationship of features between the different sample types. All statistical analysis for quantitation was performed using Prism 10 (GraphPad, San Diego, California). Differences were considered statistically significant at p <0.05. All quantified values are represented as average plus or minus standard deviation (n = 2).
Results and Discussion
Characterizing Spatial and Temporal Trends
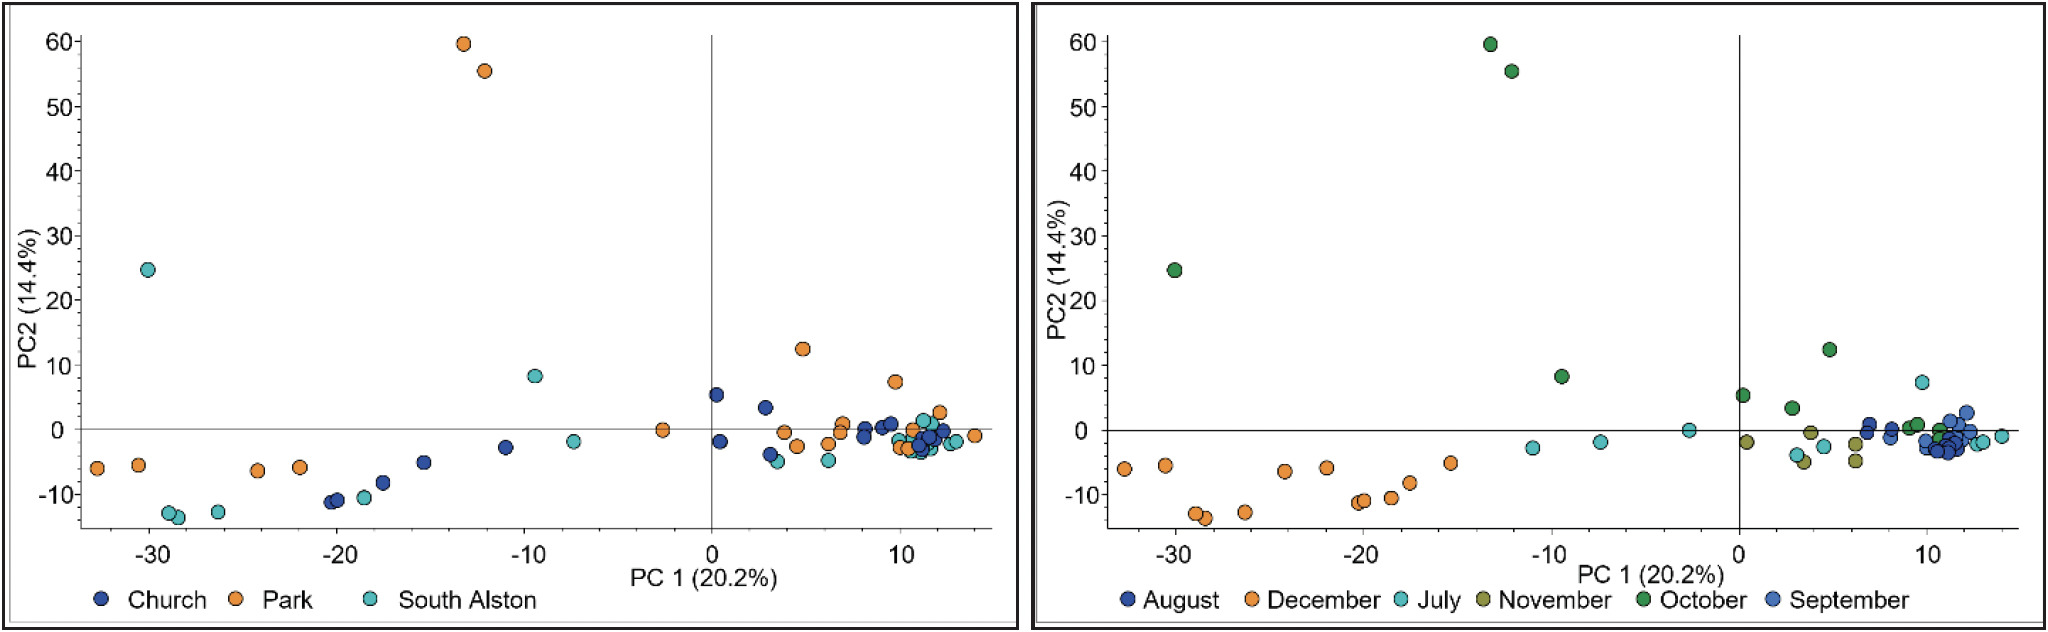
A PCA in positive mode performed using water samples labeled by month and location visually displayed similarities and variances between sample types (Figure 3). The PCA plot illustrated that water samples had very little difference based on location in positive mode; however, the Park samples clustered more closely in negative mode PCA plots (SI Figure S3). Loading plots from the PCA and differential analysis plots demonstrated that there were clusters of features likely driving differences in the samples. Regarding differences by month sampled, there were significant isolated clusters observed in July, October, and December 2022 within both positive and negative mode plots. The months of August, September, and November primarily clustered together. This difference was further confirmed by comparing the positive ion max summed peak area abundance by month, where October (1.22E9), July (1.11E9), and December (9.25E8) had the highest values out of all months (SI Excel File S6). The differences in feature abundances and type by month sampled may be accounted for by weather pattern changes and anthropogenic contaminant use patterns. Observations of stream water quantity recorded by the US Geological Survey (USGS) TFC water monitoring station demonstrate clear spikes in gauge height for TFC in the months of July, October, and December, which indicate increased inputs of water into the system and potential mobilization of contaminants. July had the highest average rainfall (7.69 inches) and warmest average water temperatures (25°C; National Centers for Environmental Information, n.d.). The combination of warm temperatures, rainfall, and commonly increased human activity was very likely to have released a variety of chemical micropollutants. Water quality parameters tested during sampling in July had, on average, the highest salinity and total dissolved solids, indicating the potential for contaminants. October was the driest month of the time points sampled (1.14 inches of precipitation) but the highest month for water levels in the creek, indicating other upstream influences on water levels and contaminant mobilization. Previous studies looking at temporal and spatial differences in water contamination showed the dry season had the highest abundance of contamination in Grand Canal, China (Xiaolong et al., 2010).
_and_month_(right)_sampled.png)
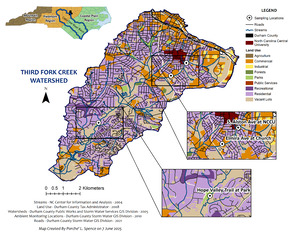
NTA detected 1,043 features in positive mode and 303 in negative mode (SI Table S5). Pairwise differential analyses (volcano plots; p <0.05 and |log2 fold change| >1) identified features that differed significantly both among months and between sampling locations (SI Figure S4). In site-to-site comparisons, Park samples exhibited the largest number of features whose abundances differed significantly from those in the South Alston and Church samples. This pattern is consistent with the land use context shown in Figure 4: the Park site is dominated by open parkland and vacant lots adjacent to residential areas, whereas the Church site is surrounded by commercial and residential development and South Alston is a more heavily urbanized area adjacent to North Carolina Central University. Together, these results indicate that, though temporal variation was a major driver of compositional change, spatial differences linked to local land use also produce distinct contaminant signatures.
Annotation of Emerging Contaminants
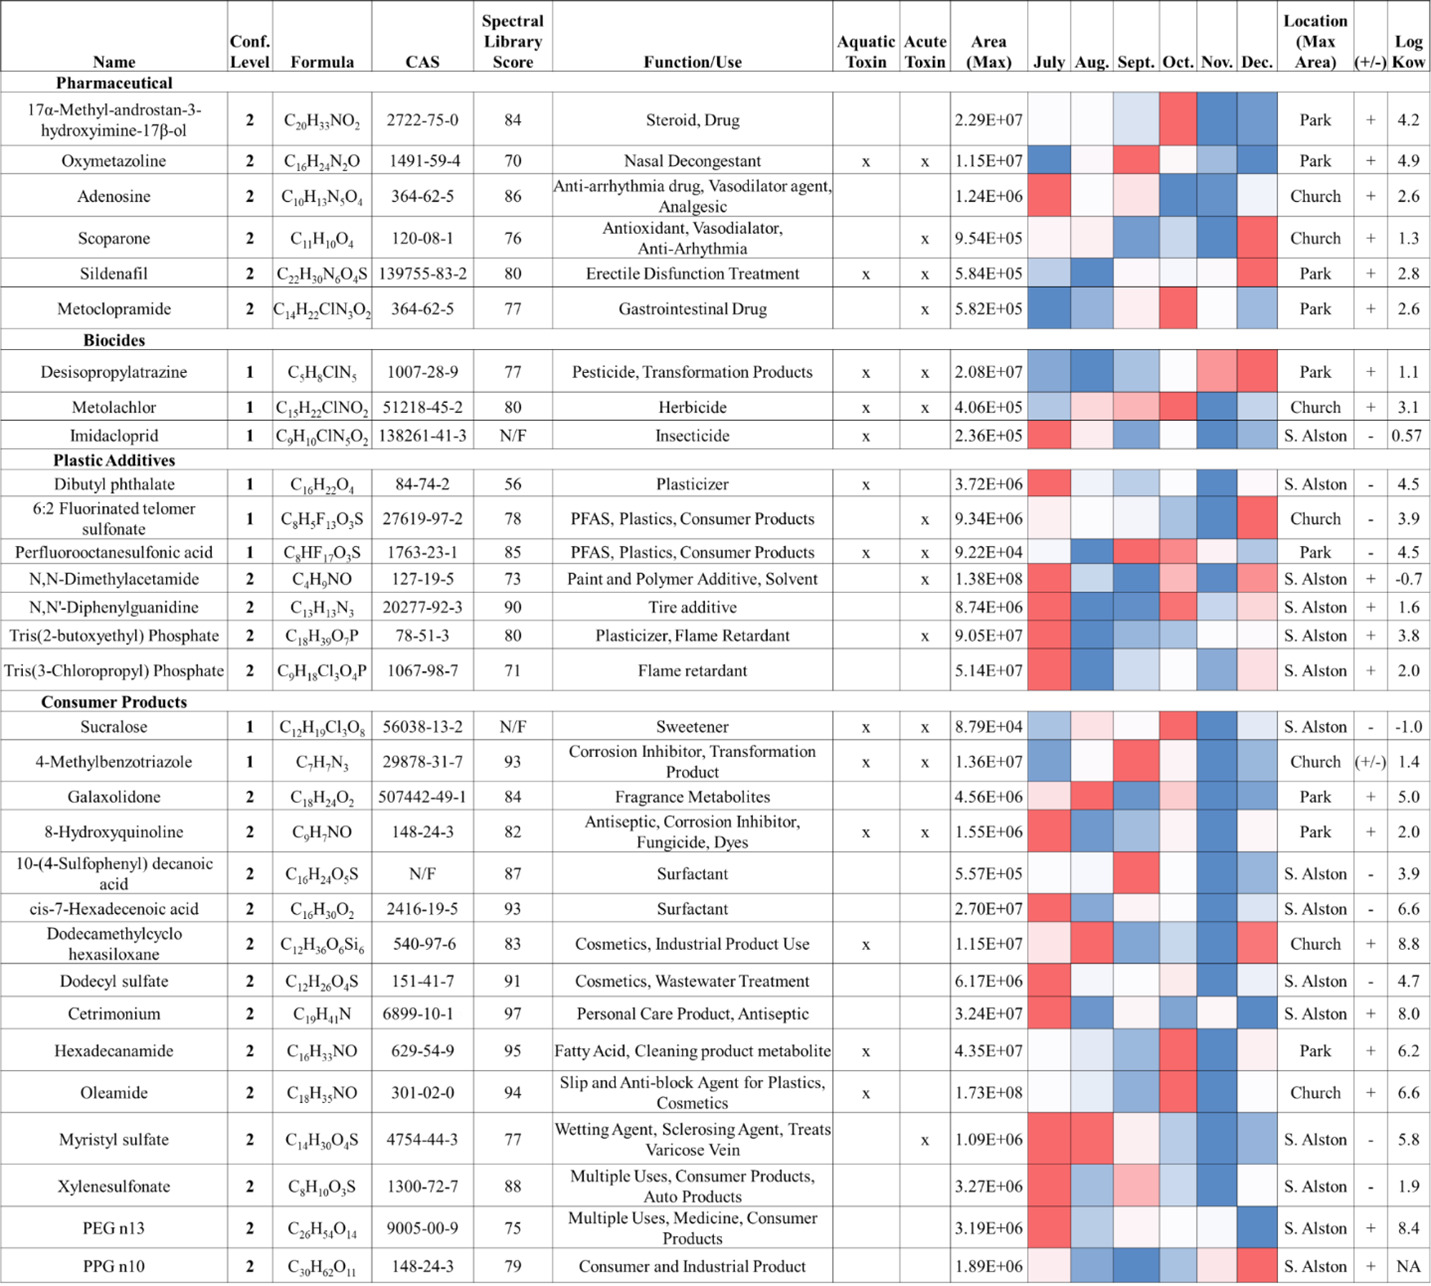
High-resolution MS/MS spectra from the samples were matched against curated tandem mass spectral libraries (MzCloud, NIST, and RTI in-house libraries) to structurally annotate 29 positive-mode and 14 negative-mode features. Analytical standards were used to confirm several compound identities. After collapsing duplicate features (retaining the feature with the highest maximum peak area), 31 unique compounds are summarized in Figure 5. These putative and confirmed contaminants span pharmaceuticals, biocides, plastic additives, and personal care product residues; several—atrazine, deisopropyl-atrazine, metolachlor, imidacloprid, sucralose, and 4-methylbenzotriazole—have previously been detected in nearby groundwater (Apex, North Carolina), illustrating the regional ubiquity of these contaminants (Hunter et al., 2021). Using PubChem hazard annotations, 21 of the 31 compounds were flagged as potentially harmful to aquatic organisms or human health. This finding is consistent with prior NTA surveys of US streams that linked numerous detected features to bioactive effects in vitro (Blackwell et al., 2018), underscoring the utility of NTA for prioritizing compounds for follow-up confirmation and risk assessment.
In Figure 5, maximum peak area patterns by location and month showed that the pharmaceuticals did not peak simultaneously in a single month; however, four of six pharmaceuticals had their highest peak areas in Park samples. Although the Park site is not adjacent to treatment plants or landfills (SI Table S6), these detections are consistent with some degree of wastewater influence (e.g., upstream inputs, septic leakage, illicit human discharges, or stormwater conveyance) in that reach of TFC. More than half (14 of 22) of the consumer product and plastic additive compounds were most abundant at the South Alston site in July 2022. South Alston is the most urbanized sampling location—adjacent to the university, the Durham County Construction & Demolition Landfill, and the North Durham Water Reclamation Facility (SI Table S6)—and July was the warmest and wettest month sampled, coinciding with peak local construction activity (Belayutham et al., 2016). Increased human activity, higher temperatures, and stormwater runoff likely contributed to the elevated July signals for urban-associated chemicals, such as the tire additive diphenyl guanidine (Obanya et al., 2024). For features without confident spectral matches, we selected the top 322 nonduplicate positive-mode peaks with available tandem mass spectra and classified them using ClassyFire. Most of these unannotated features were assigned to classes typical of natural organic matter (organic acids, heterocyclic compounds, lipids, and benzenoids; SI Figure S5; SI Table S7), suggesting a mix of biogenic and anthropogenic inputs in the creek’s chemical signature.
Trends of Emerging Contaminants
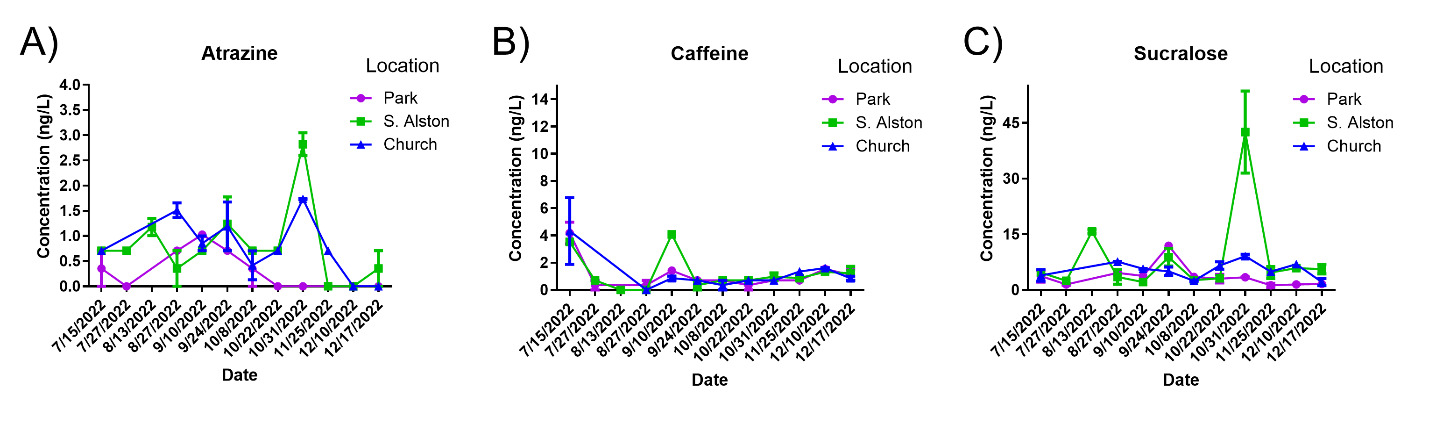
Surface waters are commonly subjected to increasing stress as related to anthropogenic activities. Within the water samples analyzed, 9 of the 23 targeted chemical pollutants were detected and semiquantified from exact parent mass within each time point and location using chemical reference standards, retention time, and parent mass (Figure 6 and SI Excel File S3). Chemical classes of those quantitated over time included herbicides, pesticides, polymer additives, PFAS, and personal care compounds. Concentrations for these analytes had varied by time and location: atrazine (1.0–3.1 ng/L), 4,8-dioxa-3H-perfluorononanoic acid (ADONA; 1.4–3.9 ng/L), dibutyl phthalate (0.7– 8.9 ng/L), caffeine (1.0–6.78 ng/L), imidacloprid (1.0–27.3 ng/L), atrazine desisopropyl (1.1–47.8 ng/L), sucralose (1.2–53.5 ng/L), 6:2 fluorotelomer sulfonate (FTS; 1.6–83.6 ng/L), and methyl benzotriazole (1.1–375.6 ng/L). Spearman correlation analysis (SI Figure S6) showed that water temperature was negatively associated with pH, as well as concentrations of ADONA, 6:2 FTS, and methyl-benzotriazole. In contrast, temperature and rainfall were positively associated with dibutyl phthalate, caffeine, and imidacloprid. These patterns indicate that routine physicochemical parameters alone do not reliably predict the occurrence or abundance of specific organic contaminants, underscoring the value of complementary chemical screening to capture pollutant dynamics.
Sucralose did not show strong Spearman correlations with routine water quality parameters, but it covaried with other indicators of wastewater influence like caffeine, a contaminant commonly studied in TFC (Spence, 2015). Sucralose reached a maximum of 53.5 ng/L at the South Alston site in October. Reported concentrations in the literature vary by setting: treated wastewater effluent is typically in the low microgram (µg)/L range (roughly hundreds to a few thousand ng/L; Subedi & Kannan, 2014), source waters for drinking water treatment plants have been reported from tens to several thousand ng/L (Mawhinney et al., 2011), and surface water levels range from single digit ng/L in minimally impacted areas to µg/L levels in effluent-dominated reaches (Heider et al., 2018). Thus, the 53.5 ng/L measured here is consistent with a detectable wastewater signal but is lower than typical effluent concentrations. Four pharmaceuticals were tentatively identified, with their largest peak areas also observed at South Alston, suggesting this site experienced the greatest influence from wastewater-derived inputs (Buerge et al., 2009). Temporal patterns, however, were not consistent across tracers: peak areas and concentrations of sucralose, caffeine, and the detected pharmaceuticals did not align across all sampling dates (Whitall et al., 2021). Differences in human metabolism and environmental persistence likely account for these discrepancies—sucralose is comparatively recalcitrant and persists longer in the environment than caffeine and many pharmaceuticals, which are more rapidly metabolized and degraded (Grice & Goldsmith, 2000; Roberts et al., 2000; Tollefsen et al., 2012). Consequently, co-occurrence of multiple tracers supports a wastewater signal at South Alston, but asynchronous temporal trends highlight the value of using several complementary indicators and repeated sampling to characterize inputs.
_atrazine__(b)_caffeine__and_(c)_su.png)
In addition to wastewater tracers, we quantified other contaminant classes over time—notably, the herbicide atrazine and its metabolite, deisopropyl-atrazine. Atrazine was measured at low but variable levels and peaked in late October; deisopropyl-atrazine, which forms primarily by microbial N-dealkylation of atrazine, reached higher concentrations with peaks in November to December. This lag between parent and metabolite is consistent with biotransformation timescales that can range from days to months, depending on temperature, microbial adaptation, and hydrologic conditions. Although observed atrazine concentrations were well below the US Environmental Protection Agency’s drinking water maximum contaminant level of 3,000 ng/L, atrazine’s mobility, persistence, endocrine-related effects, and aquatic toxicity support continued monitoring of both the parent compound and its metabolites.
PFAS—a broad class of more than 16,000 fluorinated compounds used in firefighting foams, grease- and stain-resistant products, and many industrial applications—were also detected (Habib et al., 2024). Perfluorooctanesulfonic acid (PFOS) was observed by HRMS with the largest peak area signal in the Park samples from September, but it did not exceed our limit of quantitation (1 ng/mL). Two other PFAS, ADONA and 6:2 FTS, were quantified and reached maximum concentrations in December at the Church site (ADONA: 3.9 ng/L; 6:2 FTS: 83.6 ng/L). Although these values do not exceed common regulatory thresholds, their persistence and potential for effects on ecology and human health (including immune, reproductive, and endocrine impacts and associations with certain cancers for some PFAS) justify continued surveillance and, where appropriate, follow-up targeted analyses. The differing peak times among PFAS also suggest multiple sources or input pathways. Water basin scale analysis from 2018 to 2020 found PFOS among the more frequently quantified analytes and detected 6:2 FTS above the limit of detection in a majority of samples—though sites near Jordan Lake showed lower average concentrations than other locations—underscoring the value of site-specific monitoring to identify local hotspots and prioritize management (Pétré et al., 2022).
TFC Chemical Contaminant Comparison to 2014 USGS Study
The USGS previously conducted a targeted screening of TFC (April–June 2014; 10 sampling events; SI Excel File S7), analyzing 107 pharmaceuticals and 230 pesticides but quantifying only 9 pharmaceuticals and 49 pesticides. This outcome illustrates a practical limitation of broad targeted panels: they can be costly in materials and labor while yielding low detection rates when many analytes are absent or below quantitation limits. For compounds common to both studies, concentrations in our samples—caffeine (30–332 ng/L), atrazine (2.8–86.1 ng/L), and methyl-1H-benzotriazole (205–887 ng/L)—were similar to or lower than the USGS values. Such differences likely reflect methodological factors (our extraction protocol prioritized recovery across multiple chemical classes, and our results are semiquantitative), seasonal and hydrologic variation between sampling campaigns, and differences in analytical sensitivity. A key contribution of our work is that the HRMS non-targeted workflow detected 34 compounds at confidence Level 1 or Level 2, of which 30 were not reported in the 2014 USGS survey (USGS, 2014). More than a decade has passed since the USGS organic chemical screening of TFC, so renewed monitoring is warranted. Several compounds newly detected in our study—8-hydroxyquinoline, sucralose, PFOS, metolachlor, sildenafil, and oxymetazoline—should be prioritized for follow-up targeted analyses and incorporated into future USGS and state monitoring programs to confirm concentrations and assess potential human health and ecological risks.
Conclusion
This exploratory study found that TFC exhibited pronounced monthly variability but only modest differences across the three sampling sites. Over the 6-month campaign, we detected roughly 1,300 distinct features, and structural annotation indicated diverse classes, including pharmaceuticals, biocides, polymer additives, and consumer product residues. Chemical signals associated with wastewater, agricultural management, and construction were most pronounced at the South Alston site, which showed the highest overall chemical burden in October—likely reflecting elevated creek levels and storm-driven runoff at that time. Because more than a decade has passed since the last USGS chemical screen, our NTA campaign establishes an updated, broad baseline for TFC contamination and identifies candidate compounds for follow-up.
We acknowledge that once priority analytes are identified, routine targeted analyses are generally more cost-effective for ongoing surveillance. However, NTA has distinct and lasting value: it enables discovery of unexpected or emerging contaminants and transformation products that targeted panels miss, it captures complex mixtures useful for source apportionment and risk screening, and it provides the evidence base needed to design efficient targeted monitoring programs and remediation priorities. For practical monitoring, we therefore recommend a hybrid approach: periodic NTA campaigns (e.g., after major land use changes, storms, or multiyear intervals) to update the target list, combined with more frequent, lower-cost targeted sampling for the prioritized contaminants.
Data Availability Statement
The data supporting the current study are available on Zenodo at https://zenodo.org/records/18663398.
Acknowledgments
We want to thank the North Carolina Central University–RTI International Center for Applied Research in Environmental Sciences (CARES) program for funding support, Nikki DeLuca for her assistance with the map, and Ashton Grant for her help with consolidation of mass spectral data.