
Introduction
The Supplemental Nutrition Assistance Program (SNAP), administered by the United States Department of Agriculture (USDA), Food and Nutrition Service (FNS), provides food benefits to low-income families so they can afford to purchase more nutritious food in grocery stores than otherwise. SNAP provided an average benefit of $230 per month per person to purchase food in fiscal year 2023, with approximately 42 million people (12% of the population) participating (US Department of Agriculture, n.d.). SNAP has been shown to reduce poverty by lifting the income levels of the poorest (Jolliffe et al., 2023) and to improve food security (see Carlson and Llobrera [Carlson & Llobrera, 2022] for a summary review). Results regarding the effects of SNAP on nutrition have been mixed (Gleason et al., 2021), and most studies have not found that it improves diet quality for adults or for children (Andreyeva et al., 2015; Condon et al., 2015; Garasky et al., 2016; Grummon & Taillie, 2017; Hudak et al., 2021; Katare et al., 2021; Lacko et al., 2019; Mancino et al., 2018; Singleton et al., 2020).
The purposes of this research were to explore the characteristics of households with children that joined SNAP after substantial changes were made to the program in the early stages of the pandemic and to learn how the changes affected food purchases. We used household-based scanner data to assess demographic characteristics and food purchase expenditures by category of food across households with children that (1) participated in SNAP in 2019 and 2020, (2) joined SNAP in 2020, or (3) were income-eligible nonparticipants. We describe how the findings from this research relate to the literature on why eligible households might not participate in SNAP, even with what is known about the benefits of the program on food and nutrition security. (Food security refers to people having access at all times to sufficient food, and nutrition security adds the further qualifier that the food be healthy, safe, and affordable [US Department of Agriculture Food and Nutrition Service, 2022].)
Despite the benefits of SNAP for reducing poverty and food insecurity, many people who are eligible do not participate. According to an analysis by Vigil and Rahimi (Vigil & Rahimi, 2024), 83% of households eligible for SNAP participated in the early months of 2020, with higher rates for some categories of households with children. In addition, according to data published by the USDA’s Economic Research Service (ERS), about 55% of food-insecure households participated in one or more federal food assistance programs, including SNAP; the Special Supplemental Nutrition Program for Women, Infants, and Children (WIC); and the National School Lunch Program (Coleman-Jensen et al., 2021). Many of the nonparticipating food-insecure households might be eligible to participate in SNAP and other food assistance programs.
Households might not participate in antipoverty programs including SNAP because of program factors, such as the transaction costs involved in preparing the application and periodically recertifying; household factors, such as race and ethnicity, sex, education level, and age of the household head; and other factors, such as stigma and myths regarding program dependency (Nicoll, 2015). Factors affecting SNAP participation, in particular, relate to changes in program rules or changes in personal financial circumstances, while other factors relate to inherent characteristics of the individual, such as demographics or the locations where they live (Malbi et al., 2014). For example, in a study conducted before the pandemic (Giannella et al., 2024), increasing flexibility in scheduling case-worker interviews during the enrollment process for SNAP was shown to increase participation rates. Difficulties in the recertification process due to the timing of scheduling of recertification interviews are known to decrease SNAP participation (Homonoff & Somerville, 2021). In addition, some individuals may decide that the benefits of SNAP participation are too low to be worth the effort of complying with administrative rules (Malbi et al., 2014).
Based on a review of the literature on SNAP participation, Pinard et al (Pinard et al., 2017). identified ways in which program restructuring could reduce barriers to participation. Examples were simplifying enrollment, conducting outreach and education (particularly to reduce stigma), and changing how eligibility and allotment amounts were calculated. Many of these types of changes were implemented immediately after the beginning of the COVID-19 pandemic in March 2020. For example:
-
Emergency allotments increased SNAP benefits to the maximum allowed for each household based on its size (and were later increased under a cost-of-living adjustment in October 2020).
-
SNAP operation waivers extended certification periods and waived interview requirements for initial applications and recertifications (Center on Budget and Policy Priorities (CBPP), 2023).
In response to these changes and the economic disruptions and job losses caused by the pandemic, participation and average benefits increased. The average number of participants increased from 35.7 million to 39.9 million from federal fiscal year (FY) 2019 to FY 2020, and the average monthly benefit per person increased from $129.83 to $155.06 (US Department of Agriculture, n.d.). In addition to changes in SNAP, school meal-replacement benefits (known as pandemic electronic benefits transfer, or P-EBT) were provided during school closures for children who had been receiving free or reduced-price meals, even if their families did not participate in SNAP (Center on Budget and Policy Priorities (CBPP), 2023).
Subsequent changes in SNAP during the pandemic included:
-
An additional 15% allotment starting in January 2021, and in states with emergency allotments, a minimum benefit of $95 starting in April 2021.
-
Expanded access to the pilot online purchasing program so that SNAP participants could purchase foods from approved online retailers (US Department of Agriculture, n.d.).
The 15% increase in the maximum allotment ended in September 2021, but starting in October 2021, SNAP benefits increased permanently (by 21% for the maximum benefit) (Center on Budget and Policy Priorities (CBPP), 2023) because of revisions to the FNS Thrifty Food Plan, which “outlines nutrient-dense foods and beverages, their amounts, and associated costs that can be purchased on a limited budget to support a healthy diet through nutritious meals and snacks at home.” (US Department of Agriculture, 2025) Subsequently, in early 2023, the expansion in SNAP emergency allotments in response to the pandemic expired (US Department of Agriculture, 2023). The US Census Bureau created a pictorial timeline of the changes in SNAP benefits during the pandemic, as described above (Brown et al., 2022).
Changes in SNAP at the beginning of the pandemic had immediate effects on existing participants but also provided incentives for new participants to join. Households may have joined SNAP during the pandemic because their financial circumstances changed, thus making them eligible; because the increase in benefits encouraged individuals who would have previously received small benefits to join; or because operation waivers made it easier to join. The prevalence of food insecurity remained unchanged at 10.5% of US households between 2019 and 2020, although the prevalence of food insecurity for households with children increased from 6.5% to 7.6% after several years of decline (Coleman-Jensen et al., 2021). Changes in SNAP, in addition to other food assistance programs, during the pandemic may have benefited many, but not all, households by ensuring sufficient food despite the substantial economic disruptions that occurred.
Analysis Approach
We used Consumer Network household-based scanner data from a commercial market research firm, Circana, to assess (1) the characteristics of households with children that joined SNAP during the first year of the pandemic and (2) changes in food expenditures by participating households in total and by major category of food. Household-based scanner data provide a means to easily compare differences in demographic characteristics and detailed food expenditures of households that joined SNAP during the pandemic compared with other households (see text box for more information about the Consumer Network data and identification of SNAP households).
We analyzed data for households with children that participated in the panel in 2019 and 2020 and compared across households that joined SNAP during the first year of the pandemic, participated in SNAP in both years, and appeared to be income-eligible nonparticipants. We included households in the analysis if they participated in the panel in both years so that we could make comparisons across the same set of households. We focused on households with children because these households were more likely to suffer job and income losses (Armantier et al., 2020) and had higher rates of food insufficiency during the pandemic (Armantier et al., 2020; Coleman-Jensen et al., 2021). We used the sample weights to project the sample to the US population.
To calculate food expenditures by category of food for each household, we first mapped each product to an ERS Food Purchase Group (EFPG), which is a food categorization system based on the food groupings used in the Dietary Guidelines for Americans (Sweitzer et al., 2024). The EFPGs comprise 90 subgroups within the following groups: grains; vegetables; fruit; dairy; meats and protein foods; prepared meals, sides, and salads; and other foods. After mapping all products, we summed the total dollar expenditures for each household by year and compared the values across SNAP participation status, year, and major category of food. We compared expenditures for the full year in 2019 and 2020 to avoid the effects of seasonality of food purchases that might have occurred if we had excluded the first two months of 2020, and we tested whether differences were statistically significant.
Results and Discussion
Table 1 shows the distribution of households with children by race and ethnicity based on whether the households (1) were existing SNAP participants in 2019 and continued through 2020 (referred to as 2019–2020 participating households), (2) were nonparticipants in 2019 but joined in 2020, or (3) were income-eligible nonparticipants. The number of households with children that were in SNAP more than doubled, from 1,056 in 2019 to 2,227 in 2020, with the distribution by race and ethnicity being relatively similar for existing and new participants.[1] These results suggest that changes in the SNAP program after the start of the pandemic may have encouraged households to join SNAP that might not have otherwise, or that their circumstances changed such that they became eligible. The number of income-eligible nonparticipating households with children in the panel decreased by 304 households from 2019 to 2020, either because they joined SNAP or because their income increased such that they were no longer income-eligible. However, the number of income-eligible nonparticipants in 2020 remained substantial at 1,231 (35% of the total participants and nonparticipants) and the distribution differed, with a lower percentage of Black, non-Hispanic households and a higher percentage of Asian and Other households not participating. Average household sizes and numbers of children were similar across participation status and across years. Because the composition of households was similar, we compared household income and food expenditures on a per-household rather than per-person basis.
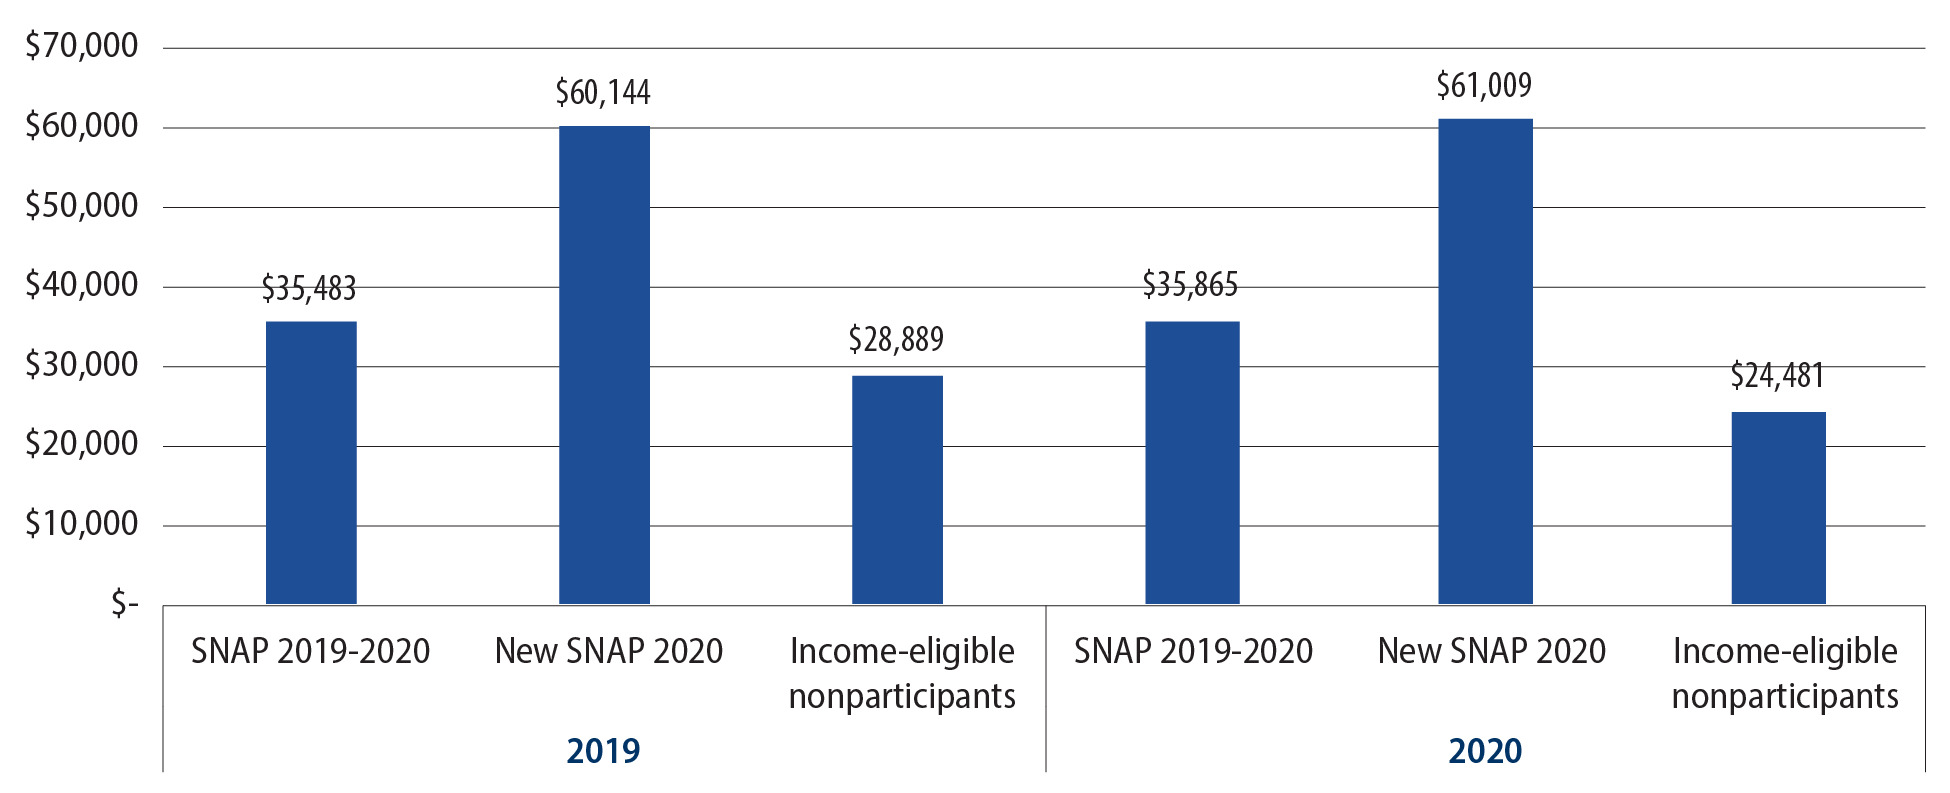
As shown in Figure 1, the average annual income of households with children that were new to SNAP in 2020 was substantially greater than those of 2019–2020 participating households with children in both 2019 and 2020. Households with higher incomes might not have participated in SNAP before the pandemic because the benefits, which are scaled based on income, were too small to make it worth their while to participate. With the increase in benefits to the maximum amount based on household size, higher-income households thus had a greater incentive to participate.[2] In contrast to participants, the average income of income-eligible nonparticipants was substantially lower in both 2019 and 2020, indicating that some of the lowest-income households did not participate. The pattern of differences in average annual income by participation status and year was similar across all race and ethnicity groups (not shown in the figure).
In 2020, income-eligible nonparticipants also reported the highest rates of unemployment, at 52% for female and 17% for male heads of households. In comparison, 2019–2020 participating households reported unemployment rates of 42% for female heads (rates for males cannot be reported due to nondisclosure rules to protect anonymity), and new SNAP participants in 2020 reported unemployment rates of 33% for female heads and 8% for male heads of household. Also, income-eligible nonparticipants and 2019–2020 participating households reported lower rates of professional/managerial employment at 16% and 24% for female and 16% and 22% for male heads of household, compared with 38% for female and 29% for male heads of household for new SNAP participants in 2020. Changes in reported employment status and positions were relatively modest between 2019 and 2020, which could have been due to lags in reporting.
As shown in Table 2, household spending on foods and beverages in stores increased substantially during the pandemic. The increases may have resulted from households shifting food purchases from FAFH sources (restaurants, cafeterias, and schools) to retail food stores; and for SNAP households, from increased benefits. In addition, some of the increase may have been because SNAP households also received P-EBT benefits that were added to their SNAP EBT cards. Mean annual household expenditures increased by $423 for existing SNAP participants (12% increase), $604 for new SNAP participants (18% increase), and $243 (8% increase) for income-eligible nonparticipants for all households combined. The largest percentage increases were for new SNAP participants across all race and ethnicity groups, with Black, non-Hispanic increasing the most.
Mean food and beverage expenditures increased regardless of participation status because of the shift from FAFH to FAH sources, but they increased more for existing and new participants than for income-eligible nonparticipants. This finding is consistent with those of Conlin and colleagues (Conlin et al., 2024), who found that SNAP households had larger increases in in-store spending than nonparticipants during the pandemic (they used data from one chain grocery retailer). We do not have data on the actual amount of SNAP benefits received by participating households to determine which portion of the increase was attributable to increased benefits versus the shift from FAFH to FAH sources. However, we can compare the percentage increases to those calculated for all populations using other data sources, such as the Bureau of Labor Statistics’ Consumer Expenditure Survey. For example, Okrent and Zeballos (Okrent & Zeballos, 2022) estimated that the portion of food expenditures on FAH increased from 58.6% to 66.4% for all types of households when they compared 2016–2019 with 2020, suggesting an increase of approximately 13%. Similarly, Dhakal and colleagues (Dhakal et al., 2022) showed an average weekly increase in FAH expenditures from $89.50 to $100.70 when they compared January 2017–February 2020 with March–December 2020, suggesting an increase of approximately 12.5%. In addition, Hylton (Hylton, 2022) showed that FAH increased 7.5% in urban areas, but decreased 7.8% in rural areas, from 2019 through 2020. The increases shown in Table 2 for new SNAP households with children exceed those reported for the general population in these studies, suggesting that the increase in benefits resulted in increased food and beverage expenditures relative to what they might have been without increased SNAP benefits and the additional benefits associated with P-EBT. This result held across all race and ethnicity groups, although the differences varied.
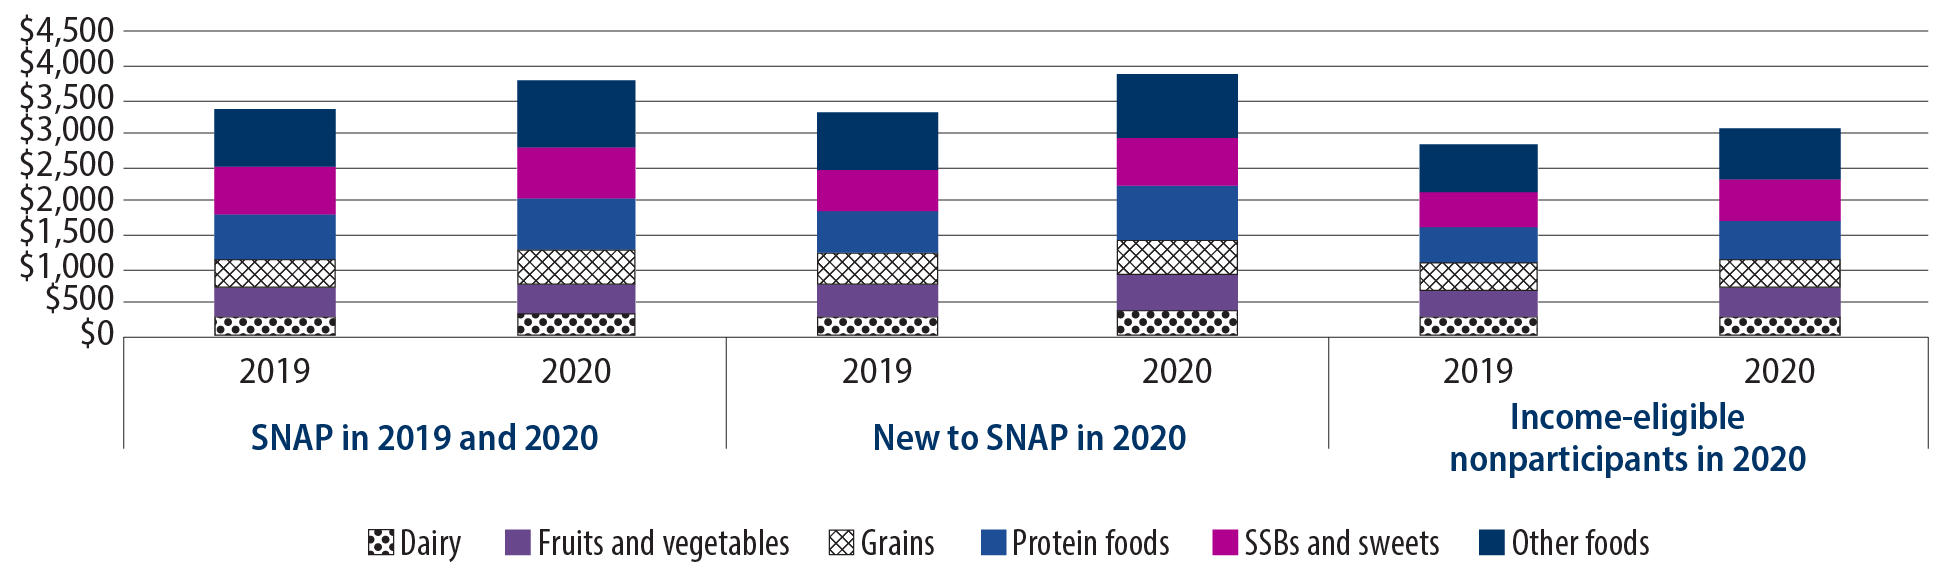
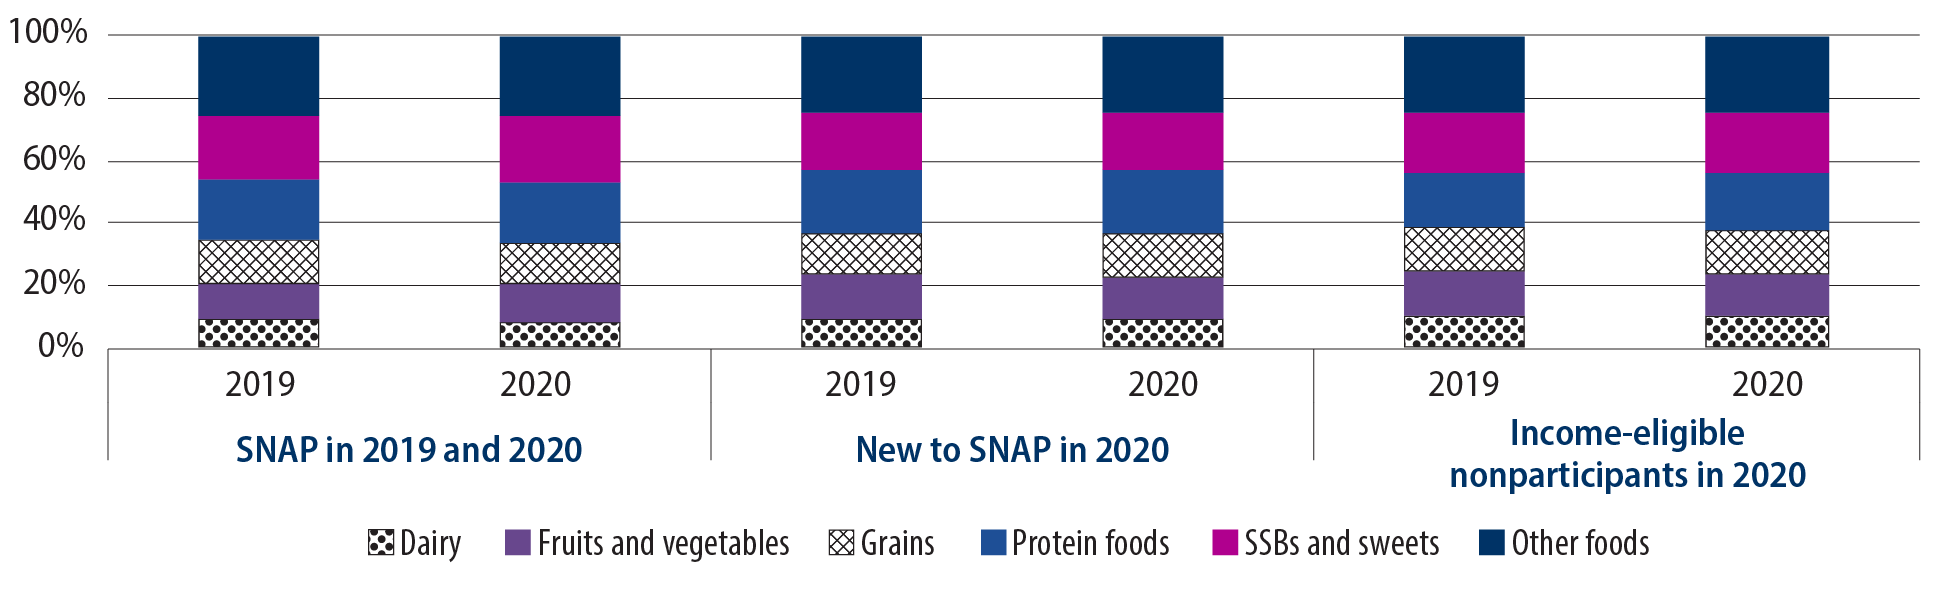
Figure 2 shows the mean annual food and beverage expenditures for households with children by participation status in 2019 and 2020 by major category of food (dairy, fruits and vegetables, grains, protein foods, sugar-sweetened beverages [SSBs], and other foods, such as prepared entrees, side dishes, and snack foods). Figure 3 shows the same data calculated as a share of total expenditures. Food and beverage expenditures increased from 2019 to 2020 and were greater for SNAP participating households than for nonparticipants. These patterns occurred within all race and ethnicity groups, except that in 2019, income-eligible but nonparticipating Black, non-Hispanic households had higher food and beverage expenditures than did participating Black, non-Hispanic households (separate figures not shown). Consistent with the findings of Okrent and Zeballos (Okrent & Zeballos, 2022), the largest expenditure increases were for protein foods and the smallest were for fruits and vegetables. Expenditures on SSBs and sweets, grains, and other foods also increased, while expenditures on dairy products did not change. However, when expressed on a share of expenditures basis, most food categories were relatively similar in 2019 and 2020 (see Figure 3).


Conclusions and Implications
Using Consumer Network household-based scanner data on household food purchases, we assessed the association between changes in SNAP on participation in the program and changes in food expenditures during the first year of the COVID-19 pandemic. Household-based scanner data allowed us to compare differences in demographic characteristics and food expenditures of households with children that joined SNAP during the pandemic compared with other households with children. Based on this descriptive analysis, we found that a large number of households with children that were participating in the Consumer Network panel joined SNAP because of either changes in the program or changes in their financial circumstances resulting from economic disruptions during the pandemic. Changes in the program were consistent with several types of changes described by Pinard et al (Pinard et al., 2017). and Giannella et al (Giannella et al., 2024). that would increase participation, including simplifying enrollment and changing how allotment amounts were calculated. Findings from this analysis indicate much larger changes in SNAP participation during the pandemic than reported in other sources. The differences could have occurred for several reasons—for example, because of the focus on households with children, because Consumer Network households were more receptive to program changes, or because some households mistakenly believed that P-EBT benefits to replace school meals were the same as SNAP. In any case, across existing and new participants, reported expenditures on foods and beverages increased substantially, which could have been due to the shift from FAFH to FAH; but a portion of the increase can likely be attributed to the increase in SNAP benefits, including the receipt of P-EBT benefits.
Many households with children in the Consumer Network panel that appeared to be eligible based on their incomes did not participate even with the program changes, suggesting that barriers remain. For those households, reported expenditures on FAH foods and beverages increased during the pandemic but by a much smaller amount than among the participating households. Spending by food category showed similar shares of expenditures in 2019 and 2020, but the total mean expenditures increased the most for protein foods, SSBs and sweets, and other foods. Although program changes during the pandemic were successful in increasing enrollment in SNAP, additional research needs to be conducted to determine the best ways to enroll some of the most at-risk types of households and to encourage use of benefits to purchase healthier foods, both of which would increase food security and nutrition security. In addition, future analyses could assess subsequent changes to participation status and expenditures on FAH foods and beverages after the sunset of the SNAP pandemic changes in 2023.
Data Availability Statement
The data used in this study are subject to third-party restrictions but can be made available with the permission of the US Department of Agriculture and Circana. Access to the data requires entering into a data use agreement and acquiring an account on a restricted data enclave (https://coleridgeinitiative.org/administrative-data-research-facility).
Acknowledgments
This research was supported by grant number 78876 from Healthy Eating Research, a national program of the Robert Wood Johnson Foundation. We appreciate input and advice from Joseph Llobrera, Center on Budget and Policy Priorities (CBPP), on the study design, Supplemental Nutrition Assistance Program (SNAP) operations and benefits, and potential policy implications.
The findings and conclusions in this article are those of the authors and should not be construed to represent any official United States Department of Agriculture (USDA) or US Government determination or policy. The findings in the article should not be attributed to the USDA Economic Research Service, CBPP, or Circana.
Gregory (2025) found an increase of over 60% in SNAP participation from 2019 to 2020 using Consumer Network data; however, the analysis also included households without children, and the comparison was not restricted to households that were in the Consumer Network data in both years.
It is also possible that some households incorrectly reported using “SNAP/Food Stamps” as a payment method when they were using P-EBT benefits to replace school meals. However, we believe this type of misclassification is unlikely given the difference in terminology.