
Introduction
As random-digit dialing has become less reliable due to its increasing nonresponse rates, many surveys have transitioned to a self-administered mode using an address-based sampling (ABS) frame (Lewis et al., 2024; Unangst et al., 2022). ABS frames are created using lists derived from the United States Postal Service Computerized Delivery Sequence file (CDS), which is a list of all addresses in the United States that can receive mail. Each address serves as a proxy for a household. Although most of the addresses in the CDS represent only one home or business, there are some addresses that receive mail for more than one household. These are known as drop points (DPs), and the households within them are known as drop point units (DPUs). Essentially, DPs serve as a single mail receptacle for all the DPUs contained within them.
The residential addresses from the CDS typically constitute the frame for ABS studies, so the remainder of this paper restricts its attention to residential addresses. DPUs make up quite a small percentage of residential addresses in the CDS overall—only about 1.5 percent of all city-style or locatable addresses.[1] The highest concentrations of DPs are in New York, New Jersey, Massachusetts, and Illinois and are mostly in urban areas. Figure 1 shows DPU concentration by county for all residential addresses on the ABS frame.
_addresses.png)
DPUs pose a specific challenge to self-administered, mail-contact surveys because there are no apartment numbers or secondary unit designators associated with them. Even though the number of DPUs contained in a DP is available on the CDS, it is extremely difficult for practitioners to target mailings to specific DPUs to participate in a survey. In nonurban areas of the United States, the proportion of DPs is small enough that removing them would not raise any concerns of coverage bias. However, the decision to exclude DPs in urban areas where DP proportions are substantially higher may not be as easy to make. If DPs are kept eligible for the survey, there are several strategies that can be implemented, including sending just a single mailing to the DP or sending as many mailings as there are DPUs in the DP (Lewis et al., 2023a). While mailing to all DPUs in a DP yields marginally more completed surveys than a single mailing to a DP, both options present issues with potential self-selection bias. Naturally, excluding DPs could introduce coverage bias if the characteristics of residents in DPUs differ from those living in non-DPUs.
An alternative to including or excluding DPUs would be to substitute them with nearby non-DPUs (Harter et al., 2022). Substitution can be used in surveys to compensate for nonresponse bias and/or coverage bias. For example, substitution can be a form of imputation to make up for unit nonresponse (Chapman, 1983; Nishimura, 2015), by substituting a nonresponding case with a new case. While this form of substitution could be seen as a departure from pure probability-based sampling, it can be argued that if the distribution of characteristics of residents of nonresponding sampled housing units are comparable to those in substitute housing units, the technique could help minimize the risk of nonresponse bias. By this logic, substitution could also be a viable option for minimizing coverage bias if residents of DPUs and their non-DPU counterparts share similar distributions for key variables of interest in the study.
The 2021 Healthy Chicago Survey (HCS)—a self-administered, mail-contact survey—experimented with such a method of substitution. The HCS used an ABS frame that comprised over 12 percent DPUs—far above the national average—which makes finding a suitable method for dealing with DPUs imperative. Before drawing the sample, the ABS frame was expanded on DPs so that any of the DPUs within a DP could be selected individually. For example, if there were three DPUs within a DP, the single record for the DP was replaced with three identical records representing the individual DPUs. To find suitable substitutes for the sampled DPUs after the sample was drawn, SAS software was used to deterministically find the closest non-DPU building with the same number of units as the DP. One of the units in the non-DPU building was then used as a substitute for the sampled DPU. To test the validity of this substitution approach, a concurrent survey was conducted using the DPUs that were originally sampled. Results discussed in Lewis and colleagues (2023b) were encouraging. There were some minor differences in sociodemographic characteristics, such as age, employment status, marital status, and housing tenure, but there were no substantive differences in key health outcomes.
Note that the survey invitations for DPUs were mailed only once because there would be no guarantee that any follow-up correspondence would reach the intended recipient (i.e., the respondent of the survey), because there is no way to send mail to a specific DPU within a DP (Lewis et al., 2023b). The typical data collection protocol for non-DPU addresses is to send up to four mailings over a 28-day period.
The purpose of the present analysis is to determine the extent to which including, excluding, or substituting sampled DPUs affects the overall results of the Healthy Chicago Survey. Specifically, our primary goal is to test for statistical significance of key health outcomes between the three methods, with the secondary goal being to quantify the expected magnitude of any point estimate differences. To make these citywide comparisons, three coverage- and nonresponse-adjusted analysis weights were created to make each group representative of the adult population of Chicago, per American Community Survey data.
In the Data and Methods section, we provide more details on the 2021 HCS and our methods of constructing the three aforementioned analysis weights. Then, we present data on the outcome distributions and corresponding significance tests for comparing analysis-weighted respondent distributions for the three conditions. Finally, we summarize our findings, explain implications for researchers, and suggest paths for further exploration of ways to handle DPUs.
Data and Methods
The HCS commenced in 2014 as an annual, dual-frame random-digit dialing telephone survey of Chicago’s adults. The Chicago Department of Public Health used the survey to obtain information to form policies addressing health inequality and to organize public health interventions. The results from this initial version of the survey were used to implement Healthy Chicago 2.0 (https://www.chicago.gov/city/en/depts/cdph/provdrs/healthychicago.html). Response rates gradually declined, which made getting the targeted number of completed surveys within the—sometimes small—77 community areas (CAs) of interest a challenge. The declining use of landline telephones and the portability of cellular telephones has made targeting specific geographies in dual-frame random-digit dialing surveys increasingly difficult (i.e., a person’s area code may not be representative of where the person lives) (Berzofsky et al., 2018). In response to these challenges, the Chicago Department of Public Health moved the HCS to a self-administered, mail-contact survey using an ABS frame (Unangst et al., 2022).
The ABS frame used in the 2021 HCS comprised 1,207,642 addresses in all, 12.1 percent (146,711) of which were DPUs situated in DPs containing two to four units each. The other 1,060,931 were non-DPU addresses. A total of 10,871 DPUs were excluded from the 2021 HCS frame due to being in DPs that contained more than four units. This is because larger DPs are usually high-rises, trailer parks, gated communities, or other alternative housing arrangements such as college dormitories or halfway houses (Amaya et al., 2014), which can cause logistical issues with data collection. These larger DPs make up only about 1–2 percent of the frame, however, so any bias in overall estimates that may occur from removing these is expected to be small.
After geocoding addresses on the 2021 HCS frame, they were stratified into Chicago’s CAs. As Figure 2 in Lewis and colleagues (2023b) shows, DPUs are most concentrated in the “bungalow belt,” a ring of CAs on the west side of Chicago. These CAs are generally less affluent and have higher density minority populations (Dekker et al., 2012). The prevalence of DPUs in CAs is not distributed homogeneously; some CAs have hardly any DPUs, whereas some in the bungalow belt have a nearly 60 percent DPU rate.
The 2021 HCS started with a sample of 18,488 addresses with the goals of getting at least 35 complete surveys in each CA and 4,200 completes overall. The initial sample contained 2,196 DPUs, which were then substituted with a non-DPU in a nearby non-DPU building of the same size as the DP. For the concurrent DPU data collection effort, DPUs received one of two treatments assigned at random: (1) a “mail to one” approach where just a single mailing was sent to the DP; and (2) a “mail to all” approach where 2, 3, or 4 mailings were sent to the DP, depending on its size. See Lewis and colleagues (2023a) for more discussion of this subexperiment.
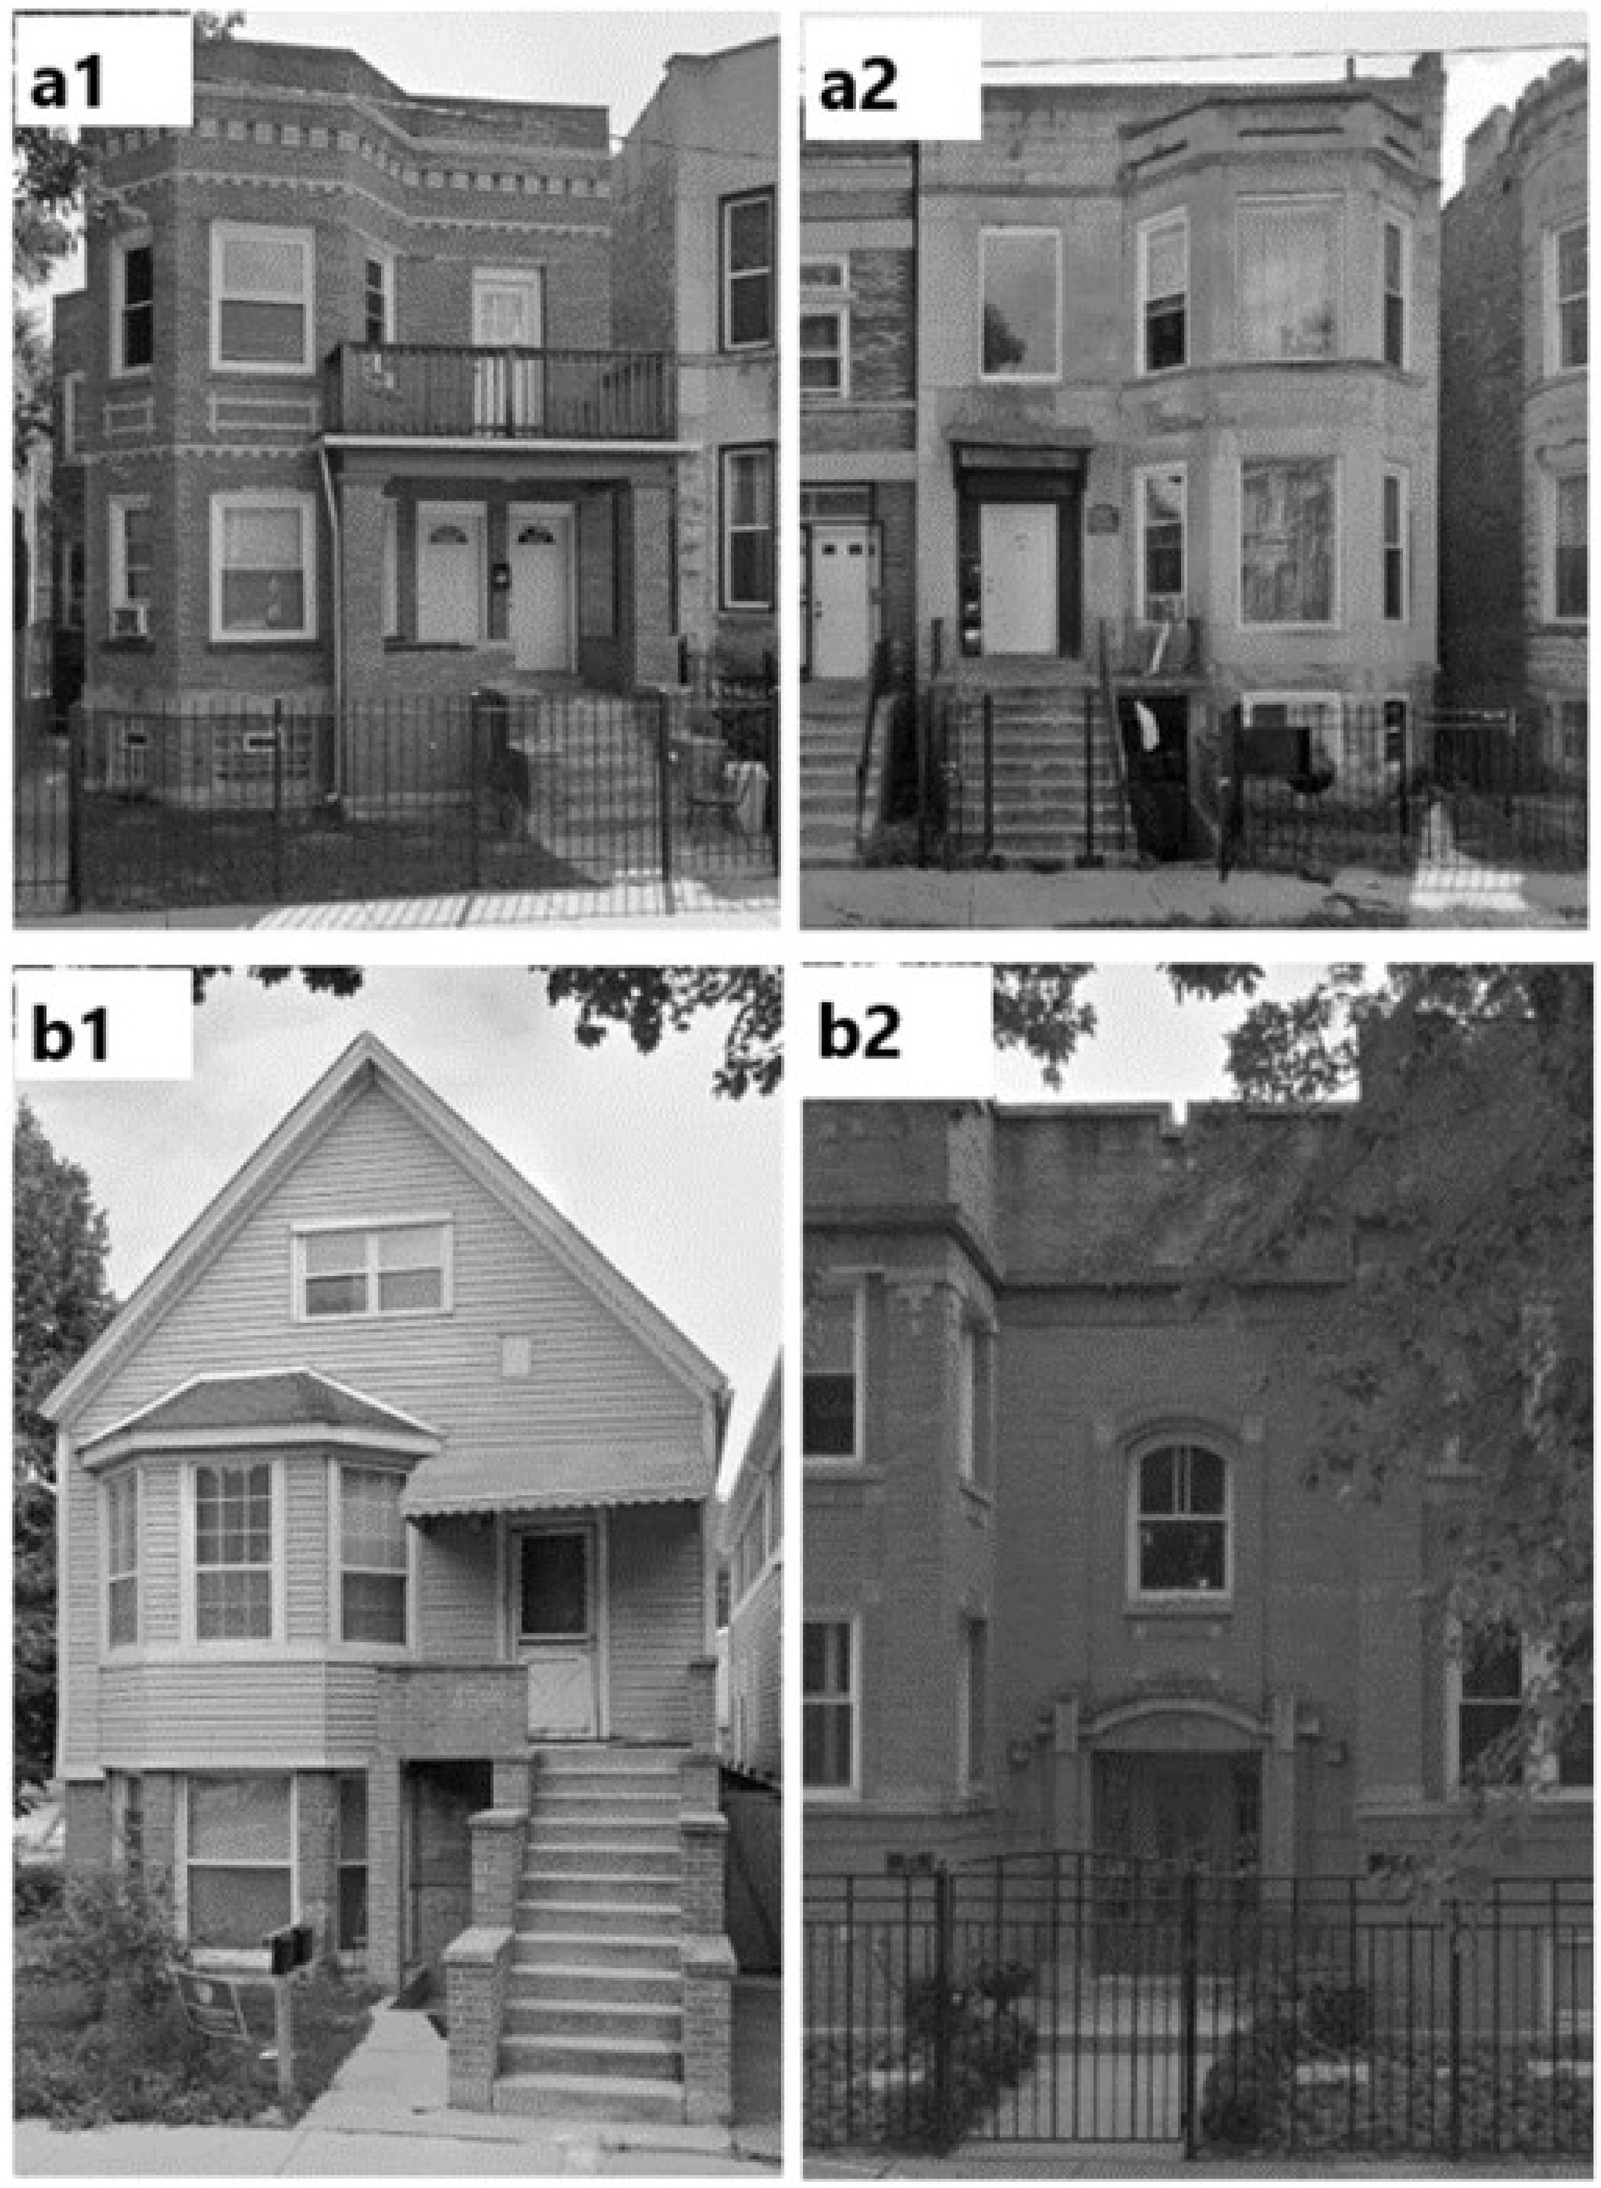
Physically, some substitutes look quite similar to the originally sampled DPU, whereas other substitutes can appear very different. Figures 2a and 2b show two Google Street View pairings of DPUs and their non-DPU counterparts. Figure 2a shows a physically similar pairing while the pairing in Figure 2b is more dissimilar. Qualitative comparisons of DPUs and non-DPUs were conducted in the 2020 Residential Energy Consumption Survey (RECS), which implemented a similar substitution method on a national scale (Harter et al., 2022). For the 2020 RECS, pairwise comparability was important because of the belief that building age and structure type could relate to its energy consumption properties. However, physical similarities between DPUs and their substitutes are less important for HCS, because the key survey estimates relate to an individual resident’s health behaviors and characteristics.

We used the GEODIST function in SAS to find the geographically closest non-DPU substitute for the sampled DPUs. The function calls in latitudinal and longitudinal coordinates of the sampled DPUs’ addresses and finds the nearest appropriate non-DPU addresses by Euclidean distance, accounting for the Earth’s curvature. Substitutes for the DPUs were found in the same CA every time, usually only 0.1 to 0.2 miles away. A substitute was at most about three city blocks away, or 0.3 miles. For 35 DPUs in the sample (5 of which responded), the selected substitute was previously used or selected to serve as substitute for at least one other DPU. In this situation, the base weight of the substitute was adjusted accordingly (RTI International, 2022). Otherwise, the base weight of the originally sampled DPU was used for the non-DPU substitute.
Unlike the previous analysis, which was primarily concerned with the differences between the respondents living in DPUs and their substitutes, the authors wanted to analyze the effect of including, excluding, or substituting DPUs on the overall survey estimates after weighting the respondents to match distributions for all adults in the city of Chicago. Thus, in addition to the core analysis weight accounting for the substitution, as originally created and used for 2021 HCS analyses—see RTI International (2022) for more details—we created two new analysis weights using the same demographics of race, sex, age, marital status, education, and housing tenure from the 2015–2019 American Community Survey 5-year data tables. The first analysis weight simulates the inclusion of DPs (i.e., no substitution), and the second analysis weight simulates the exclusion of DPs from the sampling frame (i.e., no DPs, no substitution). Three-way statistical significance tests of the weighted key health outcomes were conducted using Rao-Scott design-adjusted chi-square tests (Rao & Scott, 1984). To accommodate the covariance in the chi-square tests caused by the overlapping non-DPU respondents in all three conditions, seven pseudo-PSUs were created within each CA, and a data stacking approach was used (compare Example 5.16 in Heeringa et al., 2017) with SUDAAN’s CROSSTAB procedure. In addition to testing for overall significance, we focused on the 11 CAs with DPUs making up at least 30 percent of their addresses to evaluate whether including, excluding, or substituting DPs affected areas with a higher proportion of DPUs leading to differences of larger magnitude and/or greater statistical significance.
Results
Table 1 shows the unweighted counts of cases and yield rates for the three conditions described in the Data and Methods section. Recall that, because of the subexperiment discussed in Lewis and colleagues (2023a), the sample size of DPUs is higher than that of substitutes. The yield rate is defined as the number of completed surveys divided by the number of sampled addresses, which is used as a measure of a successful survey response. It can be inferred from the slight increase of 1.8 percent in the yield rate when excluding DPs that there were proportionally fewer respondents from DPUs than from non-DPUs (not including substitutes). Using substitutes from comparable non-DPUs instead of DPUs increased the yield rate 1.3 percent, indicating that the substitutes are somewhat more likely to respond than DPUs. For analysis purposes, it worked out nicely that the number of DPU respondents (399) and substitute respondents (401) were so close. As discussed previously, however, due to unavailable unit designations, the DPUs received only a single mailing without any follow-up attempts. This could certainly impact DPU response rates, all else being equal.
Table 2 contains the weighted percent distributions of key health outcomes of the three DP conditions for both the entire city and for only the 11 CAs that had 30 percent or more addresses being DPUs, along with indicators for which estimate differences were the largest across the three pairwise comparisons (applicable estimates highlighted). None of the 17 key health outcomes had any statistically significant differences, even for the 11 CAs with the highest proportions of DPUs. The median differences for both the entire city and the 11 CAs with the most DPUs were all less than 2 percentage points. The maximum differences for the entire city were not higher than 2 percentage points. For the 11 CAs with high DPU concentration, maximum differences greater than 5 percentage points occurred only for “usually or always” receiving needed care in past year; the condition excluding drop points was about 9 percentage points higher than either of the other conditions.
Summary
This paper extended prior research conducted by the authors using data from the 2021 HCS that compared sociodemographic and key health outcome estimates from substitutes with those of their corresponding DPUs. Specifically, the current analysis evaluated the impact on citywide health outcomes for the three methods for handling DPUs: excluding them from the survey, including them in the survey, or substituting them with nearby non-DPUs. Two additional analysis weights were created to simulate the first two conditions, using the same population benchmarks and methods as the official 2021 HCS weight, for which substitution was used. Only marginal differences were observed across the three methods, none of which were statistically significant.
We concluded analogous findings when restricting our analysis to the 11 CAs with at least 30 percent DPU concentration. The median percentage point differences between the distributions of the three groups were minimal for key health outcomes. Even though the maximum differences between the distributions of some groups were close to 10 percentage points, those differences did not appear consistently for any given characteristic or outcome. These results indicate that the outcomes of the HCS would not be meaningfully affected if DPs were excluded from the sampling frame completely, which would be the simplest and most cost-effective method.
Aside from these findings in the Chicago area, it is unclear whether practitioners could remove DPs from all surveys in all areas of the United States. Results may differ for other survey topics, or for surveys fielded in other urban areas or places with high DP concentrations. Performing similar concurrent data collection efforts of DPUs and non-DPU substitutes with other surveys in the United States would provide valuable insights in this regard. Conducting a comparable concurrent data collection of DPUs in a much larger, perhaps nationwide, survey would be more informative as well, because the sample sizes of 399 and 401 used in our study are relatively small. Other ideas for research include estimating outcomes while including DPs with five or more DPUs in the sampling frame, or investigating other, less deterministic substitution methods. Similarly, further research could consider alternative base weight adjustments, such as ones that differentially account for the geographical distance between DPUs and their substitutes, and/or adjust for multiple chances of selection.
There is also much to be learned about how DPs are established and how the mail is distributed within DPs; conducting a survey that is sent only to DPs with questions about this information and other characteristics of people living in DPUs, in the spirit of the study described by Link (2024), could greatly help researchers using ABS frames to decide whether they should include, exclude, or substitute DPUs in their own surveys.
Data Availability Statement
The data supporting the current study are available from the authors upon reasonable request.
Acknowledgments
The authors would like to thank the RTI Fellows Program for supporting the development of this paper. We note that the content of this paper was previously presented at the 2023 Joint Statistical Meetings in Toronto, Ontario. The original conference paper is available online at https://doi.org/10.5281/zenodo.10001934.
The conclusions in this article are those of the authors and do not necessarily represent the views of the Chicago Department of Public Health.
RTI Press Associate Editor: Rachel Caspar
A city-style address is one that has a physical house/building number and street name, in addition to city, state, and ZIP code. They are “locatable” because the address is the location of the residence itself and not only a mail receptacle such as a P.O. box. For more discussion of these definitions, see https://abs.rti.org/atlas/addresses/defs.