Introduction
The United States has incurred above-average Atlantic hurricane seasons since 2016 (National Oceanic and Atmospheric Administration, 2016). Fifty tropical storm systems ranging from tropical depressions to major Category 4 hurricanes caused more than 4,000 deaths and $350 billion in damage between 2016 and 2018 (National Hurricane Center and Central Pacific Hurricane Center, 2019). The impact of these storms is often described in terms of mortality, morbidity, or economics in the population of a defined geographical area. However, it is becoming increasingly important to understand the impact on subpopulations as storms increase in intensity and frequency, and significant resources are needed for recovery and future preparedness.
The impact of hurricanes is varied and complex. Since the 1950s, researchers have attempted to conduct rigorous studies to determine the population effects of weather-related disasters (Bates et al., 1963). In the aftermath of Hurricane Hugo’s devastation to the southeastern United States in 1989, public health research largely focused on healthcare utilization (e.g., emergency department visits) or trauma and psychological distress (Belter et al., 1991; Hardin et al., 1994; Lonigan et al., 1991; Sullivan et al., 1991). As storms have increased in strength and occurrence, research on environmental exposures (e.g., air and water quality), physical health outcomes (e.g., waterborne outbreaks, respiratory issues, disability), and health-risk behaviors (e.g., substance abuse) has increased (Barbeau et al., 2010; Centers for Disease Control and Prevention (CDC), 2006; Chulada et al., 2012; Fisher Wilson, 2006; Manuel, 2013; Rohrbach et al., 2009; Sastry & Gregory, 2013; Schwartz et al., 2017).
Marginalized members of affected populations with particular demographic or socioeconomic characteristics may be at greater risk for harm during and after weather-related disasters and should be prioritized for engagement by researchers, practitioners, and policymakers. For example, socioeconomic factors, including poverty and cultural norms, may affect how individuals perceive risk and how well they understand and respond to warnings (Bolin & Kurtz, 2018). A proliferation of scientific studies, popular press reports, and other media documented environmental injustices in the low-income communities of Orleans and Jefferson Parishes before Hurricane Katrina in 2005, exposing how social vulnerability, poor infrastructure, and lack of support placed high numbers of individuals and households at risk during the storm’s approach, landfall, and aftermath (Elliott & Pais, 2006; Zahran et al., 2011).
In the last decade, CDC’s Social Vulnerability Index has emerged as a useful tool for practitioners to identify local levels of risk across key domains, including socioeconomic status, minority status, language, disability, housing, and transportation (Flanagan et al., 2011). Focus has also turned to the secondary impacts of hurricanes (Lock et al., 2012). For example, displacement after Hurricane Katrina was shown to negatively impact the health of parents in low-income households (Fussell & Lowe, 2014). Following Hurricane Sandy (2012), individuals who evacuated to shelters had worse mental health than those who stayed with family or friends (Schwartz et al., 2018).
Weather-related disasters are difficult to predict; the trajectory, timing, and intensity of hurricanes, in particular, can shift quickly, making real-time research focused on vulnerable groups dangerous and infrequent. Most disaster research is therefore conducted months or years after a disaster (Vernberg et al., 1996). Rapid needs assessments, however, are conducted during or immediately following an event to establish immediate impacts, inform response, and plan for future preparedness (Malilay et al., 2014; Stone et al., 2007). The integration of such real-time assessments into disaster research may be useful, especially when study participants’ recall of threat intensity can vary over time (Heir et al., 2009).
RTI International assumed the challenge of conducting a rapid response survey in the weeks immediately following the landfall of Hurricane Florence in eastern North Carolina in 2018. Our substantive objective was to understand the characteristics and experiences of shelter clients, including measures of socioeconomics, health status, and evacuation decision-making. Specifically, we sought to determine whether individuals seeking shelter services represented community members with limited social and financial capital who were unable to establish alternative arrangements (Smith & McCarty, 2009). Our methodological objective was to test the receptivity and usability of a traditional in-person data collection tool (i.e., interviewer-administered paper questionnaire) and a novel SMS (short message service) text-based questionnaire. We explored whether SMS/text messaging could be a viable means of collecting data on the long-term post-disaster experience of evacuees. Following the initial survey, we used messaging to assess how the recovery experience varied following emergency evacuation.
Methods
Sampling
As Hurricane Florence approached the North Carolina coastline, RTI initiated discussions with the American Red Cross of Eastern North Carolina to pilot a short survey among its shelter clients. Together, we determined that research staff would have difficulty reaching emergency shelters operating during the first week and that safety issues were also a concern. The Red Cross, therefore, provided a list of long-term evacuation shelters that opened approximately 1 week after the storm’s September 14 landfall. We drew a convenience sample of shelters based on estimates of evacuees at each shelter. Selection criteria aimed for shelters with the highest volume of evacuees staying overnight and close proximity to the geographic areas that received the most damage from Hurricane Florence and/or received subsequent flooding due to the cresting of the Pee Dee and Cape Fear Rivers (i.e., Wilmington, New Bern, Fayetteville, and Lumberton).
A team of RTI survey scientists attended a 2-hour training session before entering the field. The training was designed for professional staff with a priori understanding of interviewing best practices. Field interviewers were trained on the purpose of the study, confidentiality, FAQs, questionnaire administration, emotional distress procedures, and documenting the number of participants encountered. The session reviewed the study protocol to ensure safety, minimize risk, and address any distress by evacuees that may arise as a result of participation. It also covered topics related to rapport with Red Cross shelter managers, inclusion and exclusion criteria of participants, obtaining consent, questionnaire administration, and data security. Next, field team groups (with two or three staff members each) were assigned shelters based on Red Cross information regarding the days and times when the most evacuees would be physically present. Being cognizant of privacy concerns in shelters of varying size and floorplans, RTI field staff deferred to Red Cross shelter managers about where to conduct data collection within the shelter. Given that this was an exploratory study, field interviewers were also asked to note details around entry into shelters, where interviews were conducted, barriers to participation, and any other field descriptions that would be helpful for future administrations of a similar survey. At each shelter, field staff conducted a census of evacuees who were present at the time and approached evacuees to request participation in our study.
To participate in the study, evacuees had to be civilian adults 18 years of age or older, any gender, and able to speak and understand English proficiently to provide consent. Individuals could not participate if they were under the age of 18, in the custody of law enforcement, unable to speak or understand English, or had a condition rendering them unable to communicate with field staff or provide consent. Field team members gave and read a letter to potential participants that explained the study’s purpose, the survey contents, consent to participate, and potential for follow-up. While at the shelters, and in transfer to RTI, field staff stored paper surveys and census counts in a sealed envelope that was placed in a locked backpack. All material was stored in a locked cabinet at RTI headquarters. Staff entered data into a laptop computer to transfer answers to master and backup electronic files, and subsequently destroyed paper copies. Data were stored on a secure RTI server, compliant with RTI policies and procedures and Institutional Review Board protocol review.
Instrumentation
RTI tested two instruments during this pilot study: a paper questionnaire and an SMS text questionnaire. The design and contents of the paper questionnaire were based on the Agency for Toxic Substances and Disease Registry’s Rapid Response Registry (ATSDR-RRR), which was designed to help local and state public health and disaster response agencies rapidly establish registries of persons affected by catastrophic events. The goal of the RRR is to quickly (within 5 minutes) collect data that documents potential exposures and also includes contact information for future follow-up (Agency for Toxic Substances and Disease Registry (ATSDR), 2015).
While rapid assessment is often conducted to quickly assess the basic needs of an affected population, we adapted the RRR one-page, two-sided form to focus on evacuation experiences and collect the following information: demographics (e.g., name, gender, language spoken at home, health insurance status, household composition by age), contact information for future follow-up (e.g., telephone number, email address), and evacuation experiences, including questions to determine the date of evacuation from home, needs when evacuating (e.g., medications, medical care, water, food, shelter, utilities), reasons why they evacuated to a shelter (e.g., lack of transportation, family/friends, access to medical care), level of worry for their personal safety or damage to their home, and satisfaction with emergency alerts and communications before entering the shelter. We also collected the name of the first shelter the participant stayed at to ascertain whether transfers occurred. Two additional questions assessed evacuation history and shelter use for previous hurricanes or other disasters.
After RTI staff administered the paper survey, we shared with each participant an SMS text number via the lead letter and verbal communication. We instructed participants to text “FLORENCE” to the number (833) 988-EVAC (3822). This procedure allowed participants to “opt in” to the text survey through their personal cell phones. After opting in, participants immediately received a welcome tex and next sent a 5-item text survey to participants’ cell phones for them to complete. Selected questions were similar to those used in the paper survey (e.g., gender, current location, whether the participant evacuated before the storm, whether everyone in the participant’s household evacuated, and whether the participant agreed to be contacted for future short SMS text surveys). Participants who agreed to follow-up also received the SMS text survey approximately 2 weeks after completing the paper questionnaire.
Statistical Analyses
RTI staff used SPSS software to generate frequencies for variables obtained through the paper questionnaire. We geocoded addresses of the shelters and mapped them using ARC-GIS. Residential addresses reported by participants were also geocoded and reported at the zip code and county level to protect confidentiality. We performed one-tailed chi-squared tests to evaluate whether previous evacuation history (i.e., ever evacuated for a previous hurricane or disaster; ever evacuated to a shelter) was associated with particular experiences during Hurricane Florence. We also tested whether there were associations between early evacuation during Hurricane Florence, defined as evacuation before the storm made landfall on September 14, with other behaviors or needs. We report significant associations at P < 0.10, 0.05, and 0.01, given the exploratory nature of this study. Data collected from the SMS text survey was imported into Excel to generate basic frequencies and cross-tabulations. Because of the small number of responses, we did not conduct statistical tests.
Results
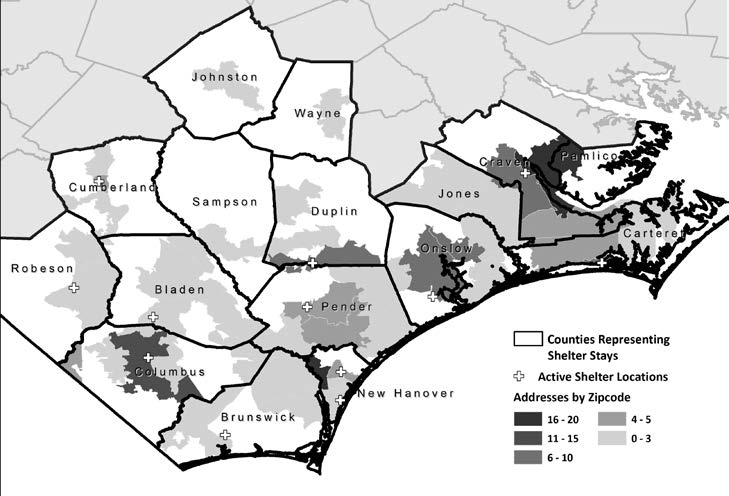
RTI field staff visited 12 shelters over 4 weeks between September 29 and October 26, 2018. We conducted 19 deployments, visiting two sites three times, three sites twice, and the remaining sites once. Field staff interviewed a total of 200 adult evacuees across the 12 sites; 45 percent of participants were interviewed at a shelter in the same town where they lived. Figure 1 shows the locations of the shelters included in the pilot study, as well as the areas where evacuees reported they resided before evacuation. Half of the shelters were set up in town recreation centers (n = 6), followed by schools (n = 3), churches (n = 2), and a sports facility (n = 1). Half of participants (n = 108, 54 percent) indicated they had stayed overnight in more than one shelter since they had evacuated. One-third of participants (n = 71, 36 percent) reported that they had stayed in three or more shelters since their evacuation. Most participants (n = 179, 90 percent) consented in the paper questionnaire to follow-up via email, text, or phone.

Table 1 displays the demographic characteristics of the cohort interviewed at the shelters (N=200). Study participants were primarily older adults (60 percent were over 44 years old), with nearly one-third (32 percent) reporting children living in their household. A majority of study participants (73 percent) were enrolled in a public health insurance (i.e., Medicaid, Medicare, VA). Our study participants also reflected those with more limited financial capital: 60 percent were unemployed, and 11 percent were homeless and unable to establish alternative arrangements.
Because of the autonomy and fluidity of clients, demographic characteristics of the true population of Red Cross clients who stayed in evacuation shelters during Hurricane Florence were unknown. However, our sample of shelter evacuees was significantly different in gender and age from the 2018 Current Population Survey adult population estimates for the affected counties (U.S. Census Bureau, n.d.). Our sample had more females than the adult population (60 percent vs. 51 percent female, chi-square = 4.55, P < 0.05). It also had fewer younger adults and more middle-aged adults than the adult population (8 percent vs. 14 percent 18–24 years old, 42 percent vs. 32 percent 45–64 years old, chi-square = 9.49, P < 0.05). However, we found no significant differences for household composition (i.e., any children, any older adult living in household). The most divergent characteristic between our sample and the adult population was employment status: only 24 percent of our study participants indicated they were currently employed, compared with 61 percent for the general population (chi-square = 85.5, P < 0.0001).
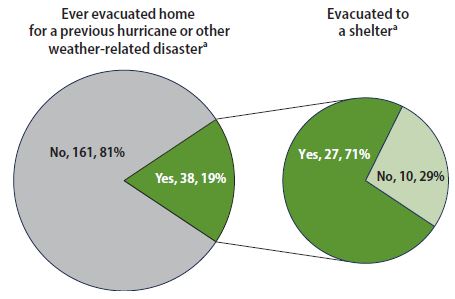
Nearly one out of five shelter participants (n = 38; 19 percent) reported having evacuated their home for a previous hurricane or other disaster before evacuating for Hurricane Florence (Figure 2). Of the 38 participants who reported having evacuated their home previously, 27 evacuated to a shelter (71 percent of those who evacuated, 14 percent of all participants).

Table 2 displays the frequencies of responses about Hurricane Florence evacuation experiences. Participants reported on the type of emergency communications they received before evacuation: radio was the most frequent source (73 percent), followed by television (70 percent) and text (63 percent). Only 2 percent of participants reported they did not receive any emergency communications at all. Almost half of participants who rated their satisfaction level with emergency communications indicated they were extremely satisfied (47 percent).
When asked about their level of worry concerning Hurricane Florence’s impact, 47 percent of participants (n = 93) reported being extremely worried for their personal safety when evacuating their residence. A higher percentage of participants (58 percent, n = 107) reported being extremely worried about the hurricane’s impact on their home or place they were living before evacuation.
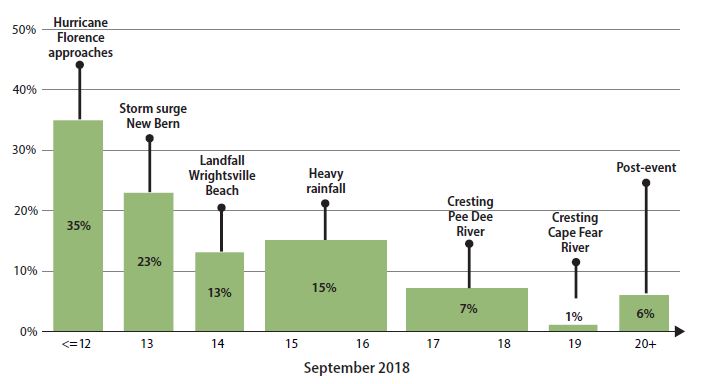
Table 2 includes timing of evacuation, and Figure 3 overlays this timing data with the progression of Hurricane Florence and its aftermath. Thirty-five percent of shelter participants indicated they evacuated on or before September 12, 2018, as Hurricane Florence approached; 23 percent reported they evacuated on September 13, the day of the storm surge; 13 percent evacuated on September 14 when the hurricane made landfall; 15 percent evacuated during the heavy rainfall days of September 15 and 16; 8 percent evacuated when the Pee Dee and Cape Fear Rivers crested between September 17 and 10; and 6 percent did not evacuate until September 20.

When questioned about needs during evacuation, the most commonly reported were medication or medical care (56 percent), followed by water or food (25 percent). The most common reason for evacuating to a shelter was wanting to stay close to home (60 percent), followed by an inability to afford another place to stay (56 percent). Thirty-one percent of shelter evacuees reported they had no family or friends to stay with.
Few variables were significantly associated with a history of evacuation for a past hurricane or other disaster. Participants who reported they had evacuated previously were more satisfied with emergency communications during Hurricane Florence (P < 0.05), more worried about the hurricane’s impact of Hurricane Florence on their home (P < 0.10), and more likely to indicate they evacuated to shelter for Hurricane Florence because they wanted to stay close to home (P < 0.01). With regard to previous evacuation to a shelter for a past hurricane or other disaster, those who reported they had previously stayed in a shelter were more likely to have evacuated this time as the storm was approaching (P < 0.05, data not shown). Respondents who reported early evacuation for Hurricane Florence were significantly more likely to have transportation to leave the area (P < 0.05) and family or friends to stay with (P < 0.001).
SMS Text Survey Reponses
Two weeks after the initial contact, RTI staff sent the SMS text survey to 152 participants who provided contact information during the visits to the shelters. The initial response rate was 22 percent (34 of the 152), with a final response rate of 15 percent (n = 22) completed. All participants selected the survey in English (n = 34). The eligibility question, requesting age, led to an attrition of 18 percent of participants. The average age of participants was 44, ranging from 21 to 69. A majority of participating participants were female (58 percent).
Overall satisfaction with emergency communications during Hurricane Florence was divided: 9 participants were satisfied, 6 participants were neutral, and 7 participants were dissatisfied. Participants who evacuated after the storm were no less satisfied with emergency communications. At the time of the SMS text survey (4 to 6.5 weeks post-event), a majority (80 percent, or 12 participants) reported that they were still in shelters, at someone’s home, or elsewhere. Only 20 percent (3 of 15) reported they were back at home.
The use of SMS text survey technology post-event yielded limited data. The high rate of attrition suggests a need for additional research to use this emerging tool in future events. Of the responses received (n = 22), the data provide a glimpse into the ongoing recovery experiences of evacuees and the potential long-term displacement of residents unable to return home, further highlighting the vulnerability of those impacted by Hurricane Florence.
Discussion
Our pilot study of North Carolina evacuation shelter clients during the aftermath of Hurricane Florence verified an a priori assumption that, during or shortly after weather-related disasters, shelters provide much needed safety for socially and economically vulnerable residents. Only 24 percent of our sample were employed, despite the majority being working age adults. This compares with 61 percent employment in the general population where our participants lived. Eleven percent of our participants also indicated they were homeless. Approximately 9,200 people experience homelessness on a given day in North Carolina, which has a population of 10.4 million (U.S. Interagency Council on Homelessness, n.d.), so we deduce that our sample also had a higher proportion of homeless adults compared the proportion in the general population. Further evidence that we reached our intended group of individuals includes participants’ self-report that 65 percent could not afford another place to stay during the hurricane and 70 percent had no family or friends to stay with.
Data obtained on previous evacuation history provided insight to our American Red Cross colleagues that they do not typically collect during client intake. Although 19 percent of participants had a history of evacuating for previous storms or other natural disasters and 14 percent had previously used shelters, there were few associations between previous experiences and current evacuation resources, behaviors, or opinions about safety. We expected that prior experiences might be positively associated with using more types of emergency communications or initiating evacuation early as Hurricane Florence approached because of an increased understanding of hurricane risks and evacuation procedures (Smith & McCarty, 2009). However, it may be that previous evacuation does not influence marginalized populations during impending storms because their resources remain extremely limited. Results from previous research on evacuation are mixed with some finding positive, negative, and no significant effects of previous evacuation and current behaviors (Gladwin & Peacock, 1997; Lindell et al., 2005; Riad et al., 1999; Smith & McCarty, 2009).
This study demonstrated that, for vulnerable populations exposed to storms of increasing intensity and frequency, traditional survey research methods are best employed when conducting research to learn about their experiences and needs. Akin to Red Cross intake procedures that collect clients’ names and contact information, we used an interviewer-led paper survey to mitigate issues related to electricity, internet service, and illiteracy among participants. We also tested the feasibility of using an SMS text survey to administer a 5-item follow-up questionnaire, but less than 1 in 4 evacuees participated. It is difficult to draw conclusions, under the circumstances, as to whether participants thought the SMS text survey was redundant with the interviewer-led survey they already completed. In this group, low response may also be an effect of the event itself in that many did not have a cell phone with which to participate. Anecdotally, some participants told field staff they lost their phone when they evacuated, or they did not want to use the text service because of potential charges against prepaid phones.
This pilot study had both strengths and limitations. Strengths included a positive working relationship with the American Red Cross that enabled us to reach our study population. Within our study population, 1 in 10 participants reported they were homeless. This highly vulnerable population would likely not be reached through more typical methods in rapid assessment (e.g., neighborhood census) or disaster research (e.g., random-digit dial or web-based surveys). The timing of our field work (i.e., after emergency shelters transitioned to evacuation shelters), was also beneficial for reaching the most marginalized community members who had to remain in shelters for extended overnight periods because of no alternative sources of assistance. Another strength of this pilot was that anecdotal accounts from our field staff indicated that participants wanted to speak about their situation during the storm and its aftermath. This willingness to speak with interviewers has been found to be beneficial for respondents in some post-disaster studies (Newman & Kaloupek, 2004).
Conversely, study limitations included potential biases related to selection, nonresponse, and sample size. Surveys were conducted in a convenience sample of Red Cross shelters for only 4 weeks. Although convenience sampling was difficult to avoid, given how often shelter locations changed during and shortly after the storm, a larger field team or extended data collection period may have yielded a larger sample with more statistical power and/or the opportunity to gather information in other shelters, such as those operated by faith-based organizations. In addition, although we had prepared the paper and SMS text instruments in both English and Spanish, a lack of Spanish-speaking field staff led us to only recruit participants who could understand English. Many of the native Spanish-speaking participants we encountered also spoke English, but nonresponse was a risk for other ethnic groups observed in the shelters who spoke languages such as Urdu or African dialects.
Recent studies in evacuation shelters after major hurricanes in the United States have focused on disease surveillance (Schnall et al., 2019). Surveillance was not the goal of this pilot, but 90 percent of participants consented for follow-up, which would allow for longitudinal assessment of their health, safety, and well-being. Follow-up of this cohort could also gather information on support services received through Hurricane Florence and its aftermath, levels of preparedness for the next hurricane season, and potential associations between the two. Other survey modes need careful consideration given our SMS text experience. The most commonly used disaster research methods (e.g., neighborhood census, random-digit dial surveys, web surveys) are also not likely to be effective approaches when the objective is to reach vulnerable groups shortly after storms. Further research is warranted to determine which survey methods best balance effort with yield to quickly capture the unique experiences of those with limited social and economic capital.
Acknowledgments
The authors thank the American Red Cross, especially Barry Porter, Regional Chief Executive Officer of the Eastern North Carolina Region, for allowing access to their gracious evacuation shelter clients during the aftermath of Hurricane Florence. The authors also thank the following RTI colleagues who, while working on their own projects and tending to personal needs through the storm, also contributed time to this pilot study: Jackie Amoozegar and Bryan Rhodes for helping conduct a literature search; our instrumentation team: Doug Currivan, Victoria Dounoucous, Charles Lau, Murrey Olmstead, Luis Sevilla, Rachel Tumin; our field team: Jackie Amoozegar, Kim Aspinwall, Tim Flanigan, Carley Gates, Melissa Hargraves, Melissa Joyner, Charlotte Looby, Katelan McDaniel, Sue Pedrazzani, Amy Ryder-Burge, Bekah Sanchez, Casey Tischner, Ryan Weber; our data entry/management team: Jaki Brown, Niki Mayo, Breda Munoz, Elysha Theis; our mapping team: Michael Phillips, Maggie O’Neil; and Laura Small for her editorial review. Finally, we thank Wayne Holden, Paul Pulliam, and Greg McDonald for their support and advocacy of our work. This project was supported by RTI intramural funds. The authors have no conflicts of interest to disclose.