Key Findings
-
Images acquired by sensors placed on satellites provide valuable information on crop acreage, health, and yields.
-
Recent progress in artificial intelligence and high-performance computing makes it possible to obtain agricultural information at low cost and in near-to-real time.
-
Unmanned aerial vehicles lessen the burden for ground-truth data collection required for satellite image classification.
-
Continuous public and commercial support for improvements in the satellite infrastructure and in the development of robust models for information extraction will pay dividends for food security and sustainability.
Introduction
Despite notable progress in reducing global poverty and hunger in recent decades, about one out of nine people in the world currently suffers from hunger and malnutrition. The share of undernourished people in the world population may have even started to rise again, reversing the earlier trend (The State of Food Security and Nutrition in the World. Building Climate Resilience for Food Security and Nutrition, 2018). Addressing the grand challenge of achieving global food security for a growing population within land and other resource constraints requires significant advances in the efficiency and sustainability of food crop production (Foley et al., 2011; Tilman et al., 2011). Stakeholders charged with making decisions pertaining to agricultural production, development priorities, and policies at a region-to-country scale require quantitative and up-to-date information on the types of crops being cultivated, the acreage under cultivation, and crop yields. However, many low- and middle-income countries (LMICs) lack the infrastructure and resources for frequent and extensive agricultural field surveys to obtain this information. As a result, data pertaining to food production may be incomplete, be out of date, be located within disparate sources, and/or lack accurate geospatial referencing; therefore, such data are of limited value for agricultural decision-making.
Technology supports a change of paradigm. Traditional methods of obtaining agricultural information through field surveys are increasingly being augmented by data acquired from other sources (Bock & Kirkendall, 2017), including images of the Earth obtained through sensors placed on satellites (Pixalytics, 2018). Recent years brought the launch of publicly supported Sentinel satellites carrying imaging sensors with the greatly improved—in comparison with their antecedents—resolution of 10 m (European Space Agency, 2019), as well as commercial satellites with an even higher resolution (Satellite Imaging Corporation, 2017). The new capability, aided by the establishment of open-access infrastructure for processing the high-resolution images (Gorelick et al., 2017; Sentinel-2, 2018) and the recent revolutionary progress in artificial intelligence (AI) (Wikipedia, 2019), now makes it feasible to obtain the information at low cost and in near-to-real time.
In this brief, we discuss the use of satellite images to provide information about agricultural production in LMICs, and we comment on research challenges and opportunities. We highlight the near-term potential of the methodology in the context of Rwanda, a country in sub-Saharan Africa whose government has recognized early the value of information technology in its strategic planning for food security and sustainability (Republic of Rwanda, Ministry of Agriculture and Animal Resources, 2009, 2016).
From Data to Information
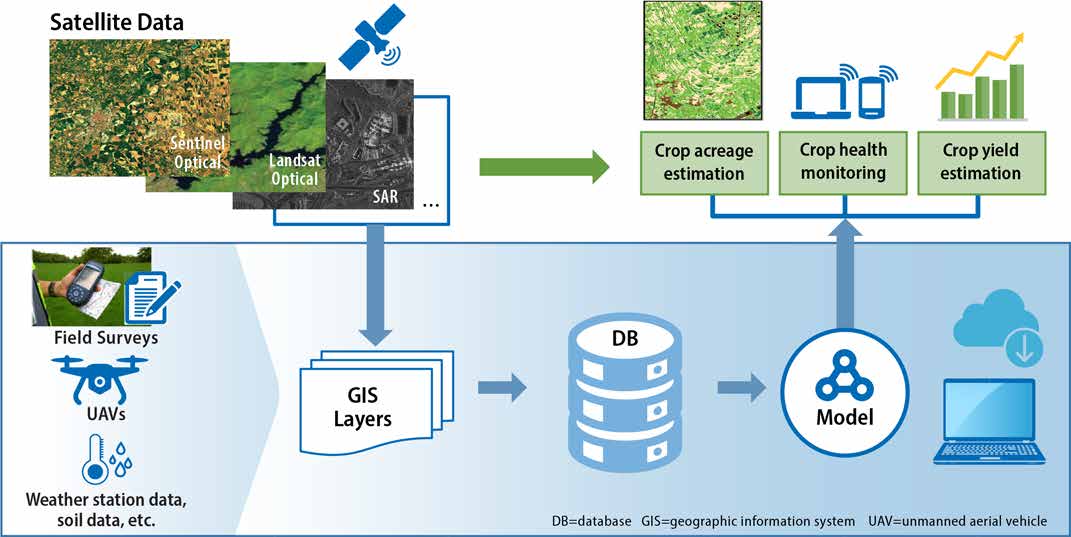
Figure 1 is a conceptual schematic of the process flow for extracting information about agricultural production from satellite images. The methodology shown in Figure 1 is a collective outcome of the work of many research groups and organizations worldwide over the last three decades and is the subject of extensive literature (Atzberger provides a good introduction) (Atzberger, 2013). The inputs are data embedded in satellite images. Optical images represent reflectance of light (solar radiation) from the Earth’s surface as a function of the wavelength of the light. For crops, this spectral reflectance is determined by the plant’s biophysical and biochemical properties, such as the leaf area, biomass, chlorophyll content, water content, and canopy structure, as well as external factors such as background soil (Jensen, 2007). Synthetic aperture radar (SAR) images represent reflectance of electromagnetic radiation in the microwave range. For crops, this reflectance is primarily a function of the canopy architecture such as the size, shape, and orientation of canopy components (leaves, stalks, fruit); the dielectric properties of the crop canopy; and the cropping characteristics such as plant density and row direction (McNairn et al., 2009). The potential output of a collective analysis of the optical and/or SAR satellite images is information about crop acreage, crop health (including incipient damage from pests; see, e.g., Zhang et al.), and crop yield. Typically, satellite sensors acquire reflectance information for specific wavelengths (bands). Continuing development in sensor technologies is increasing the number of bands and their combined spectral range, enhancing the ways in which satellite images can be used to create knowledge products.

The information extraction process, illustrated in the bottom box of Figure 1, relies on algorithms (models) that are developed (trained) using data representing the relevant “ground-truth” (i.e., ground reference data) (Congalton & Green, 2008). The ground-truth data are obtained in selected locations using field surveys and, more recently, are augmented by unmanned aerial vehicles (UAVs) (Koeva et al., 2016). Using auxiliary data, such as weather station reports, can increase accuracy of the algorithms (Cai & Sharma, 2010). Although deep machine-learning models are increasingly being used for information extraction (Kamilaris & Prenafeta-Boldú, 2018), more traditional parametric methods, illustrated later in this brief, are still commonly applied and remain a standard for benchmarking classification experiments (Maxwell et al., 2018).
Once fully developed, the AI models depicted in Figure 1 typically function on their own—they do not require a continuous ground-truth data stream. They do need to be re-parameterized whenever there are substantial changes in biophysical conditions of the agricultural production (e.g., the introduction of new cultivars or significant changes in weather patterns). The models extract information from satellite images as the images become available, resulting in dynamic maps that not only capture the state at a specific time but can also be used to monitor change—a feature particularly important for agriculture, where information is worth little if it comes too late.
Although the basic concepts shown in Figure 1 were established as early as the 1970s and the methodology has been implemented since then in an increasingly sophisticated way to provide a variety of agricultural information products at the global and continent scales (Becker-Reshef et al., 2010; Xiong et al., 2017), only recently have the satellite image resolution, data processing capability and cost of the data acquisition and processing reached the levels that make it feasible to characterize regional and even field-scale agricultural production in the situation where smallholder farms dominate, as is often the case in developing countries. The regional and field-scale, as contrasted with a global- or continental-scale, assessment is critical, given the high spatial variability of agricultural practices in smallholder systems, compounding the variability of climatic and soil conditions.
The seminal work of Burke and Lobell tracked maize grown on smallholder farms in western Kenya, using a combination of high-resolution satellite imagery and field survey data (Burke & Lobell, 2017). They constructed a crop acreage map for maize by using field data collected on both maize and nonmaize crops to train an AI model—a crop classifier—that can distinguish maize pixels from nonmaize ones. Then they applied a regression model that related data embedded in satellite images to field-measured yields to produce a field-scale maize yield forecast that they found to be roughly as accurate as the traditional field survey measures. These results indicate a substantial near-term potential to generate useful datasets on productivity in smallholder systems (Burke & Lobell, 2017).
Use of UAVs for Ground-Truth Collection
Modern technology can further simplify the task of developing the models by opening doors to using UAVs in ground-truth data collection. A fixed-wing UAV can cover an area of 100 ha in a flight lasting less than 1 hour, obtaining an aerial image with a resolution on the order of centimeters, in which each pixel is geo-referenced—a much faster, less costly, and typically more accurate process than is possible on the ground (Koeva et al., 2016).
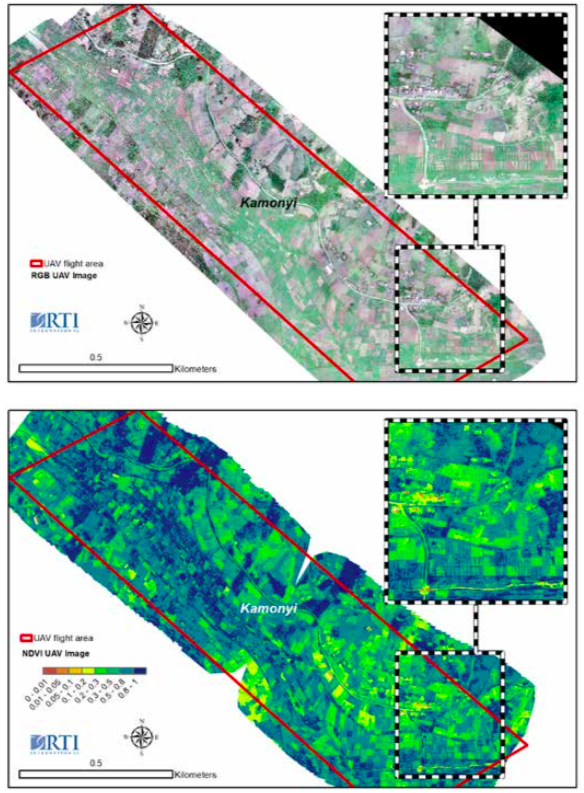
As an example, Figure 2 shows georeferenced aerial images of approximately 80 ha of land in the Kamonyi district of Rwanda, obtained in late October 2018 using an eBee Plus UAV, manufactured by SenseFly and operated by a Rwandan UAV services company, Charis Unmanned Aerial Solutions. The UAV includes a built-in data-link connection to a base station, which makes it possible to georeference the images with the accuracy of 10 cm in both horizontal and vertical directions. For this flight, the eBee UAV was equipped with SenseFly S.O.D.A. RGB [red, green, and blue] and Sequoia multispectral cameras. Figure 2a is the image obtained by the RGB camera at 3 cm resolution. Figure 2b shows a map of the same area that is derived from an image obtained by the multispectral camera. Specifically, the map shows values of the normalized-difference vegetation index (NDVI), a simple but effective index for quantifying the greenness of vegetation and other land cover. NDVI can be calculated for each pixel using the equation NDVI= where and represent the surface reflectance in the near-infrared and red bands of the optical spectrum, respectively (Candiago et al., 2015). The index normalizes green-leaf scattering in the near-infrared band and chlorophyll absorption in the red band.

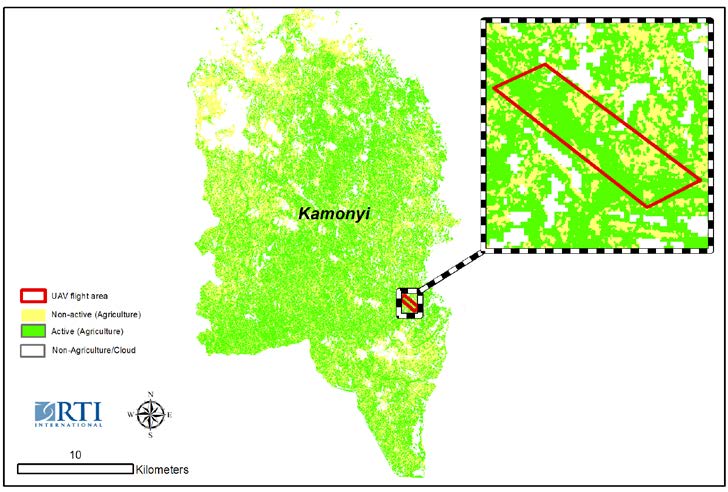
By inspecting UAV-acquired high-resolution RGB images, like the one in Figure 2a, a human analyst can create a ground-truth dataset that e.g. identifies the type of land cover. For example, it might be of interest to classify the land cover into two basic categories: category 1, “Active Agriculture,” corresponding to land under cultivation, and category 2, “Nonactive Agriculture,” corresponding to land with no/little plant growth or the land occupied by buildings and other impervious structures in otherwise agricultural areas. From the inspection of the UAV images shown in Figure 2, one can then attempt to correlate the land cover category with a range of NDVI values. Using NDVI threshold values, a computer program can then automatically classify a much larger area using a satellite image. Figure 3 shows results of such a simple classification model applied to the multispectral image of the whole Kamonyi district acquired by the Sentinel-2 satellite within a few days of the UAV flight. In the image, nonagricultural areas—like urban areas, forests, or water bodies, and pixels covered by clouds—were masked.

We estimated the accuracy of the classification by testing the model against a ground-truth dataset, again extracted from UAV images. For this test dataset, we selected different pixels (locations) than the ones that were used to develop the model. Again, a human analyst inspected UAV images and identified the land cover category. We found that the model correctly classified satellite image pixels in 88 percent of the cases.
From the map shown in Figure 3, one can estimate the area of agricultural land that was under cultivation at the time when the satellite image was obtained. After applying a correction factor for the presence of clouds, this active area was calculated to be approximately 35,000 hectares (35 kha). This number is close to our active area estimate of 36.5 kha from the Seasonal Agricultural Survey for Season A 2019, published by the National Institute of Statistics of Rwanda (National Institute of Statistics of Rwanda. Seasonal Agricultural Survey, 2019).
By applying AI techniques to satellite images acquired at different points in time—in different years, seasons, and during a growing season—one can track changes in the extent of agricultural cultivation. This type of information can also be used to monitor the start of the planting season to provide early warning of, for example, weather-related delays and accelerate potential interventions.
Future Work
District-scale cropland-extent maps are starting points to develop higher-level information products. In our work pertaining to Rwanda, we are developing models to identify land cultivated by a specific crop and extend this classification to the whole country. For Rwanda, priority food crops are maize, beans, cassava, Irish potato, rice, and wheat (Republic of Rwanda, Ministry of Agriculture and Animal Resources, 2011). To develop an AI model that distinguishes, for example, maize pixels from nonmaize pixels, we need a training dataset comprising multispectral satellite images of fields cultivated with maize and a training dataset composed of multispectral images of other type of crops in cultivation in a given time period (Burke & Lobell, 2017). The use of UAVs as high-throughput ground-truth collectors enables the required large training-data volume. We have obtained ground-truth data in several different ecological zones in Rwanda to capture variations in the spectral signatures of maize with soil and weather conditions and at several times during the growing season to obtain time-series data to increase the accuracy of the crop classification (Brown et al., 2013; Gómez et al., 2016; Lobell & Asner, 2004; Murthy et al., 2003; Wardlow & Egbert, 2008).
Longer-term objectives include the development of AI models for forecasting yields of strategic crops and the timing of harvests, based on changes in physical characteristics of the plants reflected in multispectral satellite images collected during the growing season.
Challenges and Opportunities
Acquiring satellite-driven data has inherent limitations. One of the most important ones is the effect of clouds. Clouds block images acquired using light in the visible and infrared ranges. For Rwanda, cloud cover during the two main growing seasons is significant. For example, we found that only 10 percent of the Sentinel-2 35-MRT image tiles (covering one-third of Rwanda), available for 2018 (1/1/2018 to 12/04/2018) were cloud free (cloud free describes an image in which fewer than 5 percent of pixels are blocked by clouds). The partial solution is the process of mosaicking and filling, in which a composite image is formed using cloud-free portions of the tiles acquired on different dates. SAR satellite systems that use electromagnetic radiation that is not absorbed by clouds offer the potential for additional solutions. The work on the development of a robust SAR image interpretation methodology for agricultural applications is progressing (Hosseini & McNairn, 2017).
There are also challenges and opportunities inherent in the type of agricultural system. For Rwanda, many smallholder farmers plant more than one crop on the same parcel of land. The intercropping may change optical and SAR signals from the plot as compared with the main crop and influence the accuracy of land classification, crop monitoring, and yield forecast models (Bégué et al., 2018). Plots are also very small and may require satellite images with the resolution better than 10m. However, one opportunity for better crop classification in Rwanda is that there are many consolidated land-use areas where only one crop is planted in a large area, making it more conducive to identification via machine learning.
Like any process of acquiring and processing data, extracting information through automated, computer-driven analysis of satellite images comes with uncertainty (Foody & Atkinson, 2002; Giacco et al., 2010; Lu & Weng, 2007). The most direct way of assessing the uncertainty is to test the model predictions against a ground-truth test dataset, as shown in an earlier example. A way to limit the uncertainty and increase the model robustness is to increase the quantity and quality of ground-truth training data, acquisition of which is a major bottleneck. We believe that the increasing availability of UAVs will accelerate data collection, whereas ongoing improvements in open-source data processing platforms will continue to decrease the burden of data preprocessing and further increase the pace of the development of analytical tools.
Impact
The agricultural sector is the backbone of Rwanda’s economy—it contributes more than 33 percent of GDP and is the biggest employer (Republic of Rwanda, Ministry of Agriculture and Animal Resources, 2016). The country’s food demand continues to grow, reflecting fast population growth, and agricultural productivity and total production need to increase dramatically to meet the demand. Satellite systems have the near-term potential to provide stakeholders in countries where smallholder systems dominate with information on crop production, status, and yield that is timely, covers large areas, captures spatial and temporal detail, and can be obtained at a low cost. Based on the information, stakeholders will be better prepared to make intervention decisions earlier in the growing season if needed and will have tools to assess long-term impacts of policies and investments. The information could also be used to detect pockets of rapidly increasing food insecurity, sparking a response that could alleviate political instability in areas that rely heavily on agricultural production. Continued public and commercial support is needed, not only for improvements in the satellite infrastructure and the development of robust models for information extraction, but also for implementing the new data analysis tools to address development challenges (Crouch, 2015). United Nations Pulse Laboratory Kampala provides an example of an effective initiative (United Nations Global Pulse, 2018). The continued support will pay dividends for food security and sustainability.
Acknowledgments
We gratefully acknowledge the financial support of RTI International through its Grand Challenge Initiative. We have benefited greatly from discussions with Melanie Bittle and other members of the RTI PSDAG project, stakeholders in the Government of Rwanda, United States Agency for International Development, United Kingdom Department for International Development, European Union, World Bank, UN Food and Agriculture Organizations and many nongovernment organizations operating in Rwanda. Noel Ujeneza, as well as Mads Knudsen from Vanguard Economics have also provided critical support to advance this analysis.